MantidWorkbench#
Overview of the new MantidWorkbench interface#
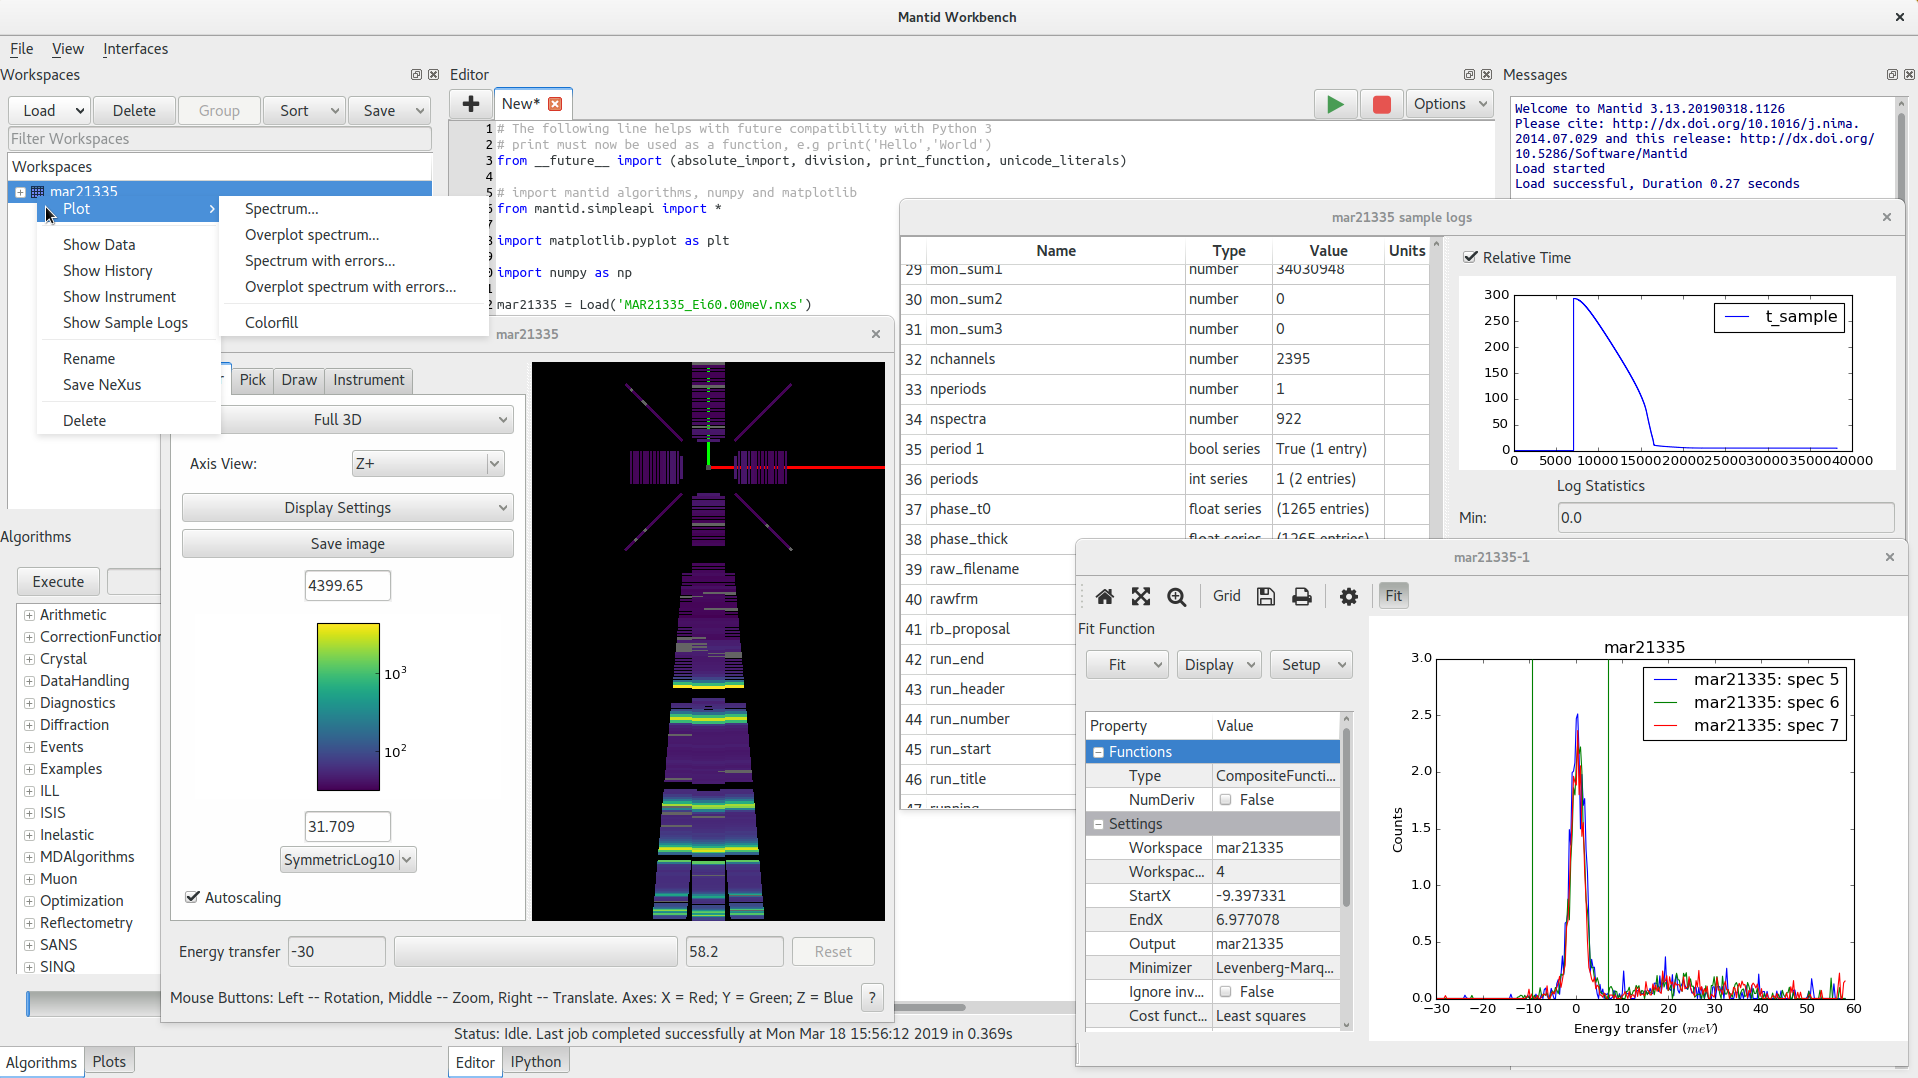
This release sees the introduction of a brand new graphical user interface, MantidWorkbench, which will eventually replace MantidPlot. The
workbench has been built from the ground up to allow more automated testing in an effort to vastly improve on the stability of MantidPlot.
Key goals:
matplotlib-based plotting: Matplotlib is the defacto-standard plotting package for the scientific community and one of its core goals is to produce publication-quality plots
cleaner interface: MantidPlot had many toolbars, buttons and menus that would confuse new users.
MantidWorkbenchaims to have a simpler interface and removes many legacy tools that were unused fromMantidPlotsupport for high-dpi displays: Based on Qt5, allowing for improved handling of high-resolution screens such as retina displays
Features Available#
The following features are available in this first release of the MantidWorkbench:
Workspace toolbox: Display and interact with the workspaces generated by mantid
Matplotlib plots: Line, errorbar and color plots from workspace menu
Workspace data views: Display data from
MatrixWorkspace/TableWorkspaceand editTableWorkspaceInstrument view: Visualize an instrument attached to a workspace
Sample log viewer: Display information, plots and statistics about the sample logs in a workspace
Workspace history window: Display the algorithms that have been applied to a workspace
Python script editor: Edit and execute Python scripts
Algorithm toolbox: Choose algorithms to execute on workspaces
Plots toolbox: Display and interact with existing plots
IPython console: Immediate execution of Python commands
Messages window: Display mantid log messages and Python output
See the workbench documentation for complete guide to the new interface.
Future#
This first release introduces features that we consider applicable to most if not all scientific areas that Mantid covers. Our development model focuses on getting useful things out to users and iterating on this feedback. However, we realise that there are key features, e.g. the slice viewer, that are missing. The following is a planned list of features that we will be continuing to develop:
Port of all scientific interfaces required
Slice Viewer/Spectrum Viewer
Generating a script from a plot
Improved tools for editing plot properties
Subplot (grid of plots) tools
Built-in help
About window
Script repository tool
There is also planned time for working on feedback that we hope to receive on this first iteration of the interface.
The date for MantidPlot to be removed from the installation has not yet been set. The removal will be announced
well in advance.
Feedback#
We would be grateful of any feedback on the new interface to any of the usual means of communication:
there is a forum thread that can be used to report feedback
the standard
mantid-helpmailing addressif you are at a facility then we are more than happy to come and have a chat.