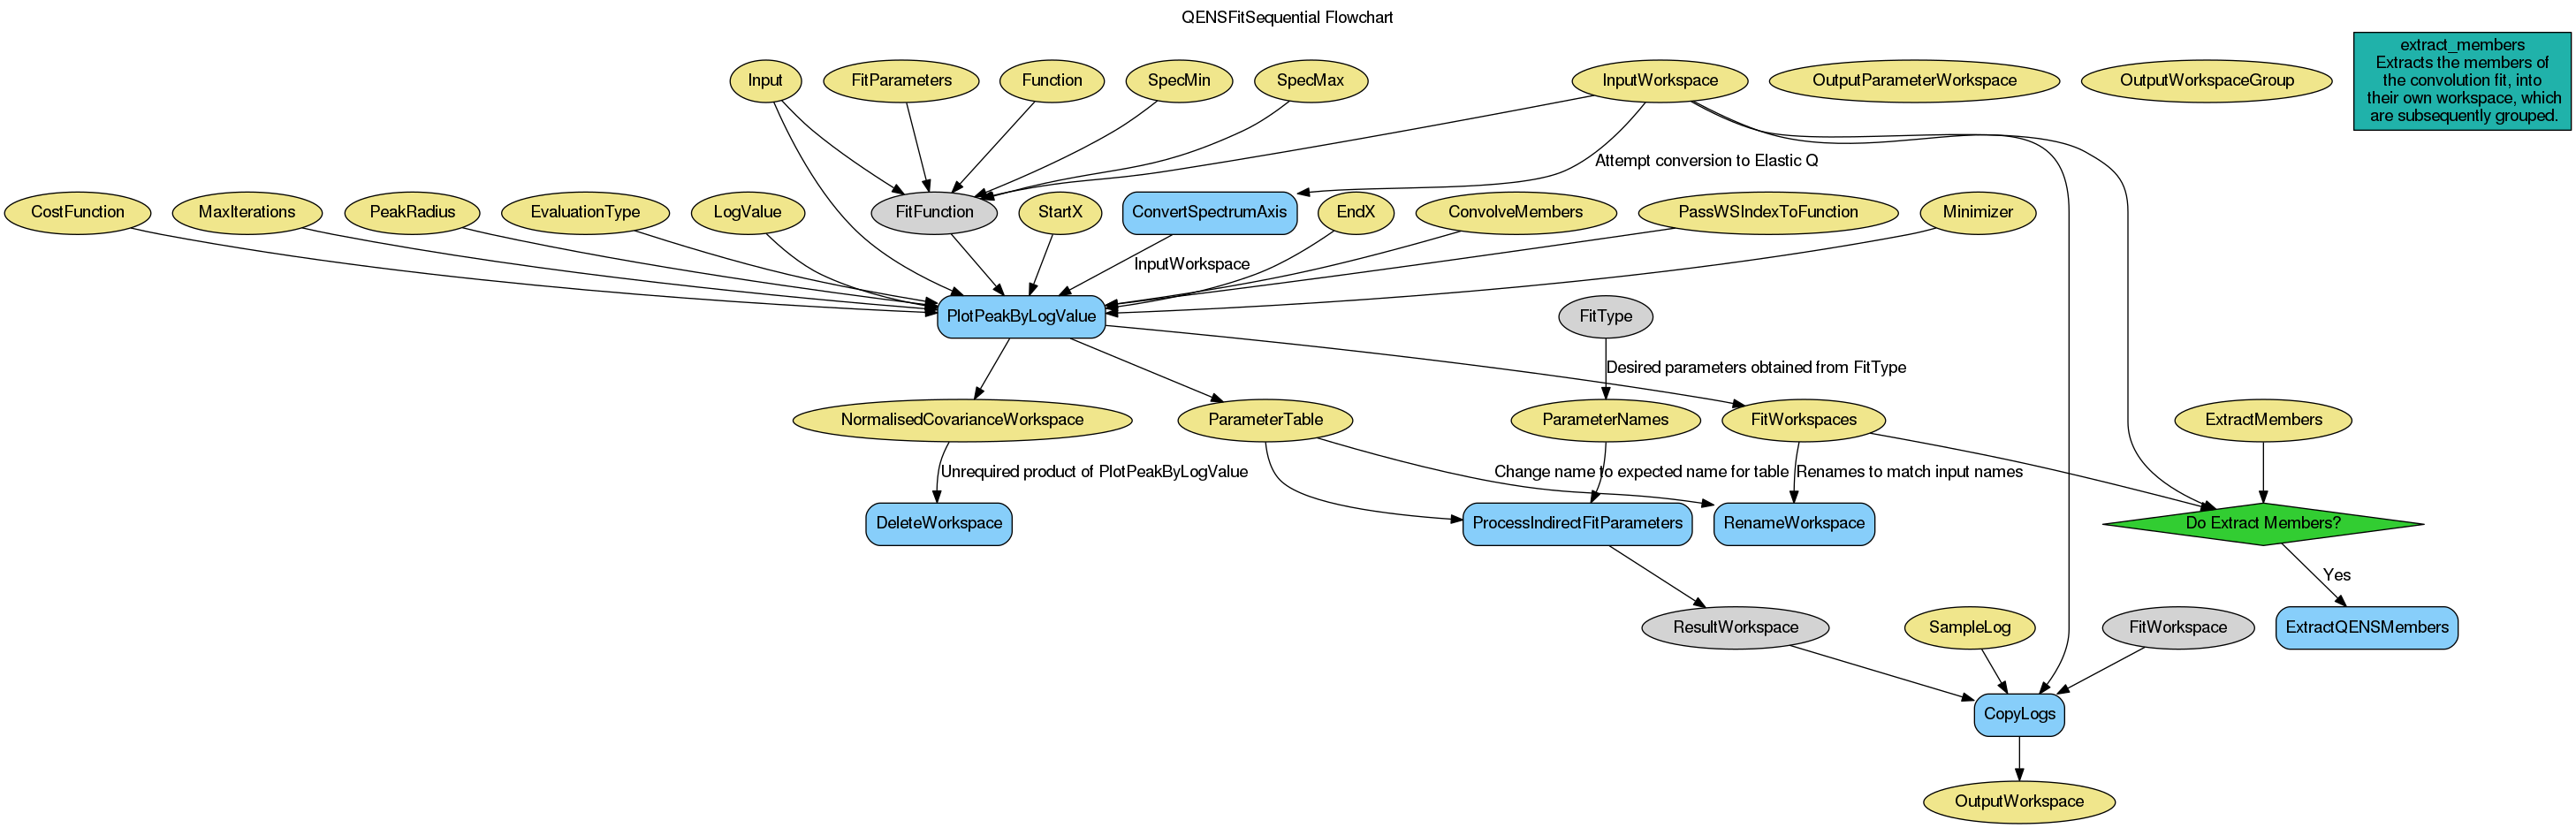
QENSFitSequential dialog.
Table of Contents
| Name | Direction | Type | Default | Description |
|---|---|---|---|---|
| InputWorkspace | Input | MatrixWorkspace | The input workspace for the fit. This property will be ignored if ‘Input’ is provided. | |
| SpecMin | Input | number | 0 | The first spectrum to be used in the fit. Spectra values can not be negative. This property will be ignored if ‘Input’ is provided. |
| SpecMax | Input | number | 0 | The final spectrum to be used in the fit. Spectra values can not be negative. This property will be ignored if ‘Input’ is provided. |
| Input | Input | string | A list of sources of data to fit. Sources can be either workspace names or file names followed optionally by a list of spectra/workspace-indices or values using the notation described in the description section of the help page. | |
| OutputWorkspace | Output | WorkspaceGroup | Mandatory | The output result workspace(s) |
| OutputParameterWorkspace | Output | TableWorkspace | The output parameter workspace | |
| OutputWorkspaceGroup | Output | WorkspaceGroup | The output group workspace | |
| Function | InOut | Function | Mandatory | The fitting function, common for all workspaces in the input. |
| LogValue | Input | string | Name of the log value to plot the parameters against. Default: use spectra numbers. | |
| StartX | Input | number | Optional | A value of x in, or on the low x boundary of, the first bin to include in the fit (default lowest value of x) |
| EndX | Input | number | Optional | A value in, or on the high x boundary of, the last bin the fitting range (default the highest value of x) |
| PassWSIndexToFunction | Input | boolean | False | For each spectrum in Input pass its workspace index to all functions thathave attribute WorkspaceIndex. |
| Minimizer | Input | string | Levenberg-Marquardt | Minimizer to use for fitting. Minimizers available are ‘Levenberg-Marquardt’, ‘Simplex’, ‘FABADA’, ‘Conjugate gradient (Fletcher-Reeves imp.)’, ‘Conjugate gradient (Polak-Ribiere imp.)’ and ‘BFGS’ |
| CostFunction | InOut | string | Least squares | Cost functions to use for fitting. Cost functions available are ‘Least squares’ and ‘Ignore positive peaks’. Allowed values: [‘Least squares’, ‘Rwp’, ‘Unweighted least squares’] |
| MaxIterations | Input | number | 500 | Stop after this number of iterations if a good fit is not found |
| PeakRadius | Input | number | 0 | A value of the peak radius the peak functions should use. A peak radius defines an interval on the x axis around the centre of the peak where its values are calculated. Values outside the interval are not calculated and assumed zeros.Numerically the radius is a whole number of peak widths (FWHM) that fit into the interval on each side from the centre. The default value of 0 means the whole x axis. |
| ExtractMembers | Input | boolean | False | If true, then each member of the fit will be extracted, into their own workspace. These workspaces will have a histogram for each spectrum (Q-value) and will be grouped. |
| ConvolveMembers | Input | boolean | False | If true and OutputCompositeMembers is true members of any Convolution are output convolved with corresponding resolution |
| EvaluationType | Input | string | CentrePoint | The way the function is evaluated: CentrePoint or Histogram. Allowed values: [‘CentrePoint’, ‘Histogram’] |
| Exclude | Input | dbl list | A list of pairs of real numbers, defining the regions to exclude from the fit. | |
| IgnoreInvalidData | Input | boolean | False | Flag to ignore infinities, NaNs and data with zero errors. |
An algorithm used for fitting QENS-data sequentially and formatting the output. Uses the PlotPeakByLogValue algorithm to perform the sequential fit.
The string format expected by the “Input” property of this algorithm is outlined in PlotPeakByLogValue.
Example - QENSFitSequential
from __future__ import print_function

# Load sample and resolution files
sample = Load('irs26176_graphite002_red.nxs')
resolution = Load('irs26173_graphite002_red.nxs')

# Set up algorithm parameters
function = """name=LinearBackground,A0=0,A1=0,ties=(A0=0.000000,A1=0.0);
(composite=Convolution,FixResolution=true,NumDeriv=true;
name=Resolution,Workspace=resolution,WorkspaceIndex=0;
name=Lorentzian,Amplitude=1,PeakCentre=0,FWHM=0.0175)"""
startX = -0.547608
endX = 0.543217
specMin = 0
specMax = sample.getNumberHistograms() - 1
convolve = True  # Convolve the fitted model components with the resolution
minimizer = "Levenberg-Marquardt"
maxIt = 500

# Run algorithm
result, params, fit_group = QENSFitSequential(InputWorkspace=sample,
                                              Function=function,
                                              PassWSIndexToFunction=True,
                                              StartX=startX, EndX=endX,
                                              SpecMin=specMin, SpecMax=specMax,
                                              ConvolveMembers=convolve,
                                              Minimizer=minimizer, MaxIterations=maxIt)
Categories: Algorithms | Workflow\MIDAS
C++ source: QENSFitSequential.cpp (last modified: 2018-07-02)
C++ header: QENSFitSequential.h (last modified: 2018-06-29)