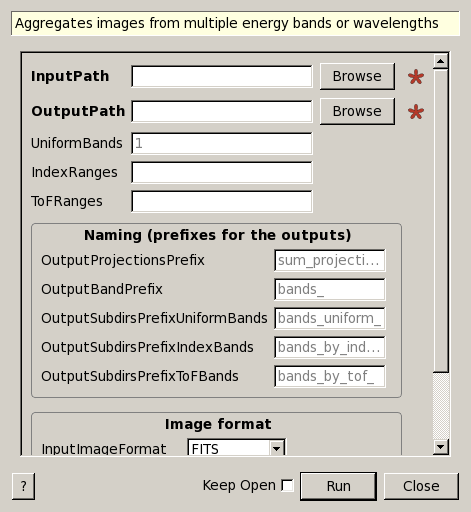
ImggAggregateWavelengths dialog.
Table of Contents
| Name | Direction | Type | Default | Description |
|---|---|---|---|---|
| InputPath | Input | string | Mandatory | The path (directory) to the input image files. It must contain image files (radiography) or subdirectories containing image files (radiography, one directory per projection angle) |
| OutputPath | Input | string | Mandatory | The path (directory) where to generate the output image(s). |
| UniformBands | Input | number | 1 | The number of output bands. The input bands are divided into uniform non-overlapping blocks and each of the output bands correspond to one block. This is a convenience particular case of the property IndexRanges |
| IndexRanges | Input | string | A comma separated list of ranges of indices, where the indices refer to the input images, counting from 1. For example: 1-100, 101-200, 201-300. The number of ranges given will set the number of output bands. If you just need a certainnumber of bands split uniformly you can alternatively use the simple property UniformBands | |
| ToFRanges | Input | string | A comma separated list of time-of-flight ranges given as for example 5000-10000. These will be the boundaries in ToF that delimit the output bands. The units are as specified in the input images headers or metainformation (normally units of microseconds). The algorithm will produce as many output bands as ranges are given in this property. The ranges can overlap | |
| NumProjections | Output | number | The number of projections (subdirectories with images) found in the input path and successfully processed | |
| NumBands | Output | number | The number of wavelength or energy bands found in the inputs and successfully processed (aggregated) into the output(s) | |
| OutputProjectionsPrefix | Input | string | sum_projection_ | This prefix is added in the output file names to precede the projection sequence number (or angle, or simply the input directory index). The names of the output files then look like: sum_projection_bands_idx_1_1200, as in addition to this prefix, another prefix is added with the indices of the input images included (see option OutputBandPrefix |
| OutputBandPrefix | Input | string | bands_ | This prefix is used for the output file names in addition to the prefix that specifies the projection or input directory sequence number, (OutputProjectionsPrefix). The output bands will be written into subdirectories with names where the prefix is prepended. In addition to this prefix, a second prefix that specifies whether the input bands were aggregated by indices or by time of flight is also appended. For example when running this algorithm using the property UniformBands or IndexRanges the output subdirectoy names will look like ‘sum_projection_bands_idx_1_1200’ (where the 1 and 1200 derive from the division into uniform non-overlaping blocks of input bands, or the index ranges given. When running the algorithm using the property ToFRanges the output names will look like ‘bands_tof_10000_50000’ (where the 10000 and 50000 are the time of flight boundaries of the output band, using the same units as in the image headers). |
| OutputSubdirsPrefixUniformBands | Input | string | bands_uniform_ | This prefix will be used for the name of the output subdirectories of every output band when producing uniform output bands (property UniformBands) |
| OutputSubdirsPrefixIndexBands | Input | string | bands_by_index_ | This prefix will be used for the name of the output subdirectories of every output band when producing output bands using index ranges (property IndexRanges) |
| OutputSubdirsPrefixToFBands | Input | string | bands_by_tof_ | This prefix will be used for the name of the output subdirectories of every output band when producing output bands using ToF ranges (property ToFRanges) |
| InputImageFormat | Input | string | FITS | From the input directory(ies) use images in this format and ignore any other files. Allowed values: [‘FITS’] |
| OutputImageFormat | Input | string | FITS | Produce output images in this format. Allowed values: [‘FITS’] |
| OutputBitDepth | Input | number | 16 | The bit depth or number of bits per pixel to use for the output image(s). Only 16 bits is supported at the moment. Allowed values: [‘16’] |
Warning
This algorithm is experimental and it is at the moment being developed for a specific instrument (IMAT at ISIS). It might be changed significantly, renamed, or even removed without a notification, should instrument scientists decide to do so.
Warning
The property ToFRanges requires specific headers in the input (FITS) files and it is not enabled. At the moment, trying to use this property will produce an error.
This algorithm aggregates images from multiple energy bands or wavelengths into one or more output wavelength bands. The algorithm applies to energy selective imaging data. It aggregates images by summing up counts, and assumes that the image pixel values represent neutron counts.
Given an input path (directory) and an output path (directory) the algorithm will combine images from the input path and write the result into the output path. Two different uses are considered: neutron radiography (single projection angle) and tomography (multiple projection angles). The image format supported is FITS (using the algorithm LoadFITS v1).
The algorithm produces its main outputs as files on disk. It also outputs two values: the number of projections (or angles) processed successfully (which will be always one for neutron radiography), and the number of wavelength bands aggregated. One and only one of the options UniformBands, IndexRanges or ToFRanges must be specified. This defines the number of output bands and how the input bands are aggregated or combined into the output bands.
For the sake of simplicity let us explain first the files that the algorithm produces when a single output band is generated. This single output band could correspond to the aggregation of all or a subset of the input bands. This is the case when the property UniformBands is set to 1, or the properties IndexRanges or ToFRanges are set to a single range (and not multiple ranges separated by commas).
For neutron radiography data the input path points to a set of image files where every file is assumed to correspond to a different wavelength or energy band. The algorithm will produce an image in the output path by combining the energy bands selected (as specified in the algorithm options, and using all the input images as default).
For neutron tomography data the input path points to a set of subdirectories, one per projection angle, and each of them containing image files. It is assumed that each of the directories corresponds to a projection angle. The algorithm will produce as many images in the output path as subdirectories are found in the input path a single image in the output path by combining the energy bands selected, separately for every input subdirectory, i.e., projection angle (selecting the bands as specified in the algorithm options, and using all the input bands as default). The images are written in a subdirectory that is named depending on the type of aggregation used. For the uniform bands (UniformBands property) the subdirectory will be named bands_uniform_idx_<start>_to_<end>, where <start> and <end> are the limits of the range(s). When the index ranges option (IndexRanges) is used the names of the output subdirectory will be named bands_index_idx_<start>_to_<end>. And when the time of flight range option (ToFRanges) is used the names will be bands_tof_idx_<start>_to_<end>. The initial prefix (bands_uniform, bands_index, bands_tof) can be mofified via the input properties OutputSubdirsPrefixUniformBands, OutputSubdirsPrefixIndexBands, OutputSubdirsPrefixToFBands, respectively.
The output images are created as described above when there is a single output band or stack of images. When multiple output ranges are specified the outputs are produced similarly but every range will be generated in a separate subdirectory created under the output path given to the algorithm. For example the algorithm would produce subdirectories named bands_by_index_idx_0_99, bands_by_index_idx_50_149, and bands_by_index_idx_99_149, or bands_uniform_idx_0_49, bands_uniform_idx_50_99.
A relevant consideration is how to use the range options to generate multiple output stacks of images. This is very important for performance reasons and concerns how to use the properties IndexRanges and ToFRanges. The comma separated list of ranges enables the user to generate multiple output stacks of images in one call to this algorithm. The same result can be obtained by calling the algorithm repeatedly with the different individual ranges, one at a time. This second alternative would be significantly slower though, and it is discouraged to use that approach in scripts. That is because the algorithm would need to read through the input images for every individual call. This can make a big different in terms of run time, given that this algorithm is meant to process large sets of images which can take of the order of tens of minutes or hours to read and/or write depending on the disk resources available.
As the algorithm tries to find images and subdirectories with images from the input path, to decide whether to process the data as a single projection (radiography) or multiple projections (tomography), there can be ambiguities. When an input path is given that contains both image files and subdirectories with image files, the algorithm processes the image files and does not try to process the subdirectories. That is, it is assumed that the input path given contains data for a single projection, and that the subdirectories do not necessarily contain images for different projections (tomography data).
Example - ImggAggregateWavelengthsSingleProjection
# Create an image combining all energy bands
projections, bands = ImggAggregateWavelengths(InputPath='D:\Data\RB000000\SampleA\',
                                              OutputPath='D:\Data\RB000000\SampleA_all_wavelenghts'
                                              UniformBands=1)

if 1 != projections:
   print "An error happened. Expected to process one projection but processed: {0}".format(projections)
# Print some details
print "Wrote a projection image combining {1} wavelength bands".format(bands)
Output:
Wrote a projection image combining 2000 wavelength bands
Example - ImggAggregateWavelengthsTomography
# Create a stack of images that can be used in tomographic reconstruction
angles, bands = ImggAggregateWavelengths(InputPath='D:\Data\RB000000\SampleA\',
                                         OutputPath='D:\Data\RB000000\SampleA\all_wavelenghts',
                                         UniformBands=1)

# Print some details
print "Wrote {0} projection images, each combining {1} wavelength bands".format(angles, bands)
Output:
Wrote 144 projection images, each combining 2000 wavelength bands
Categories: Algorithms | DataHandling\Imaging