Table of Contents
This user interface allows for batch processing of data reduction for reflectometry data. The actual data reduction is performed with ReflectometryReductionOneAuto. Wherever possible, this interface attempts to use reasonable defaults, either loaded from the instruments’ parameter files, or calculated from the provided data, to minimise the amount of user input required. This interface also strives to be transparent, making it clear how your data is being processed, and easy to adjust any of the options used.
Integration with data archives is also provided, allowing for data to be located and prepared for reduction automatically.
IPython notebooks which document the processing steps and output relevant plots can also be produced from the interface.
Information on how to resolve common problems can be found in the Troubleshooting section of this document.
To follow this example you will need the ISIS reflectometry example materials:
These can be downloaded as part of the ISIS example data.
Once they are downloaded, place the nxs files in one of Mantid’s user directories. To see a list of directories, click on File -> Manage User Directories. INTER_NR_test2.tbl can be saved anywhere you like, as long as you know where it is.
Open MantidPlot, and open the ISIS Reflectometry (Polref) interface. Interfaces -> Reflectometry -> ISIS Reflectometry (Polref)
Within the interface, we first want to import the tbl file as a TableWorkspace. To do this, click on Reflectometry -> Import .TBL. A LoadTBL dialog will open. Select INTER_NR_test2.tbl as the file, and enter MyTable as the output workspace.
A table workspace called MyTable should now exist in the ADS (Analysis Data Service). In addition the table workspace should be opened as well and the processing table (shown below) should now contain four rows (13460, 13462, 13469, 13470).
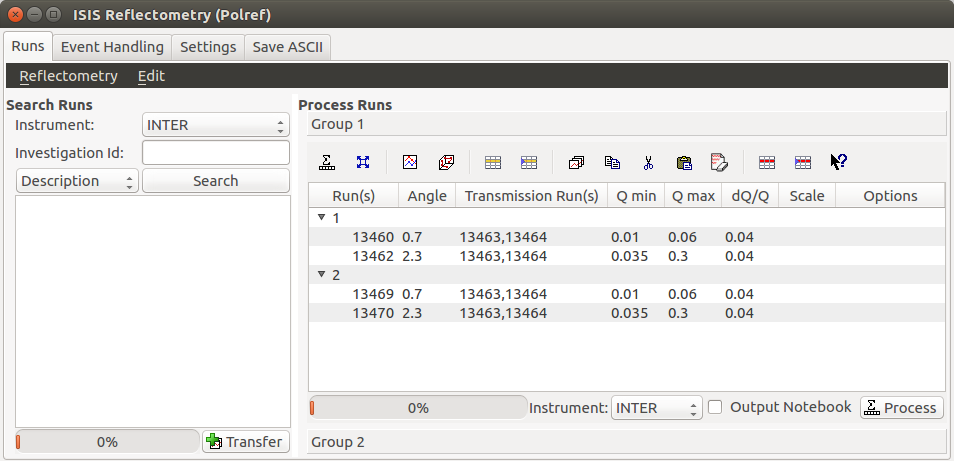
Let’s process the first group, which consists of the first two rows of the table (13460 and 13462). The simplest way to do this is simply to select the group we want to process, and then click on Process.
Tip
If you receive an error, consult the Troubleshooting section of this document for guidance on fixing it.
You should now have eleven workspaces in the ADS.
Amongst them should be:
This section describes the different elements in the Runs tab.
_interface.png)
_menuBar_widget.png)
The Reflectometry menu provides access to the following functionality:
| Action | Effect |
|---|---|
| Open Table | Opens a valid TableWorkspace in the Processing Table for processing. |
| New Table | Discards the current contents of the Processing Table presenting a blank table. |
| Save Table | Saves the current contents of the Processing Table to the TableWorkspace it came from. If no such workspace already exists, a new one can be created. |
| Save Table As | Saves the current contents of the Processing Table to a new TableWorkspace. |
| Import .TBL | Opens a LoadTBL dialog, enabling you to load a .tbl file into a TableWorkspace. |
| Export .TBL | Opens a SaveTBL dialog, enabling you to save a TableWorkspace to a .tbl file. |
| Options | Opens the Options menu. |
| Slit Calculator | Opens the slit calculator: a tool to help calculate the correct geometry for the instruments’ slits. It’s powered by the CalculateSlits algorithm. |
The Edit menu provides access to the same actions found in the tool bar. These are documented in the Tool Bar section of this document.
_groupProcessPane_widget.png)
The processing table is where the bulk of the work takes place. It is used to specify which runs to process, the properties that should be used to process them, and how the different runs should be joined together.
Each row represents a single reduction (i.e. execution of ReflectometryReductionOneAuto), and belongs to a group. Rows that are grouped together will have their output stitched together using Stitch1DMany.
Above the processing table is a tool bar containing various actions for manipulating the processing table.
Below the table is a progress bar, which shows the current progress of any processing that is in progress. And at the bottom, near the Process button is the processing instrument selector. The processing instrument is used to help identify the correct data to load when processing runs.
Next to the Process button there is a checkbox which allows enabling and disabling output to an ipython notebook. If the checkbox is enabled, a dialog window will ask for a save location for the notebook after processing is complete. A generated notebook contains python code to repeat the processing steps and output relevant plots.
This table details the behaviour of the actions in the tool bar, from left to right.
_rowToolBar_widget.png)
| Action | Effect |
|---|---|
| Process | Processes the selected runs, or, if no runs are selected, all of the runs in the table. When a group is selected, runs belonging to the same group are stitched together. |
| Expand Selection | Expands your selection such that the group containing the row you have selected is selected. |
| Plot Selected Rows | Creates a plot of the IvsQ workspaces generated by any of the selected rows. |
| Plot Selected Groups | Creates a plot of the stitched IvsQ workspaces generated by any of the selected groups. |
| Insert Row | Adds a new row after the first selected row, or at the end of the group if a group was selected. If nothing was selected the new row is appended at the end of the last group. |
| Insert Group | Adds a new group after the first selected group, or at the end of the table if no groups were selected. |
| Group Rows | Takes all the selected rows and places them in a group together, separate from any other group. |
| Copy Rows | Copies the selected rows to the clipboard. In the clipboard, each column’s value is separated by a tab, and each row is placed on a new line. |
| Cut Rows | Copies the selected rows, and then deletes them. |
| Paste Rows | Pastes the contents of the clipboard into the selected rows. If no rows are selected, new rows are inserted. |
| Clear Rows | Resets the cells in any selected rows to their initial value, in other words, blank. |
| Delete Row | Deletes any selected rows. If no rows are selected, nothing happens. If the single row of a group is selected for deletion, the group will also be deleted. |
| Delete Group | Deletes any selected Groups. If no groups are selected, nothing happens. |
| What’s This | Provides guidance on what various parts of the interface are for. |
| Column Title | Required? | Description |
|---|---|---|
| Run(s) | Yes | Contains the sample runs to be processed. Runs may be given as run numbers or workspace names. Multiple runs may be added together by separating them with a ‘+’. Example: 1234+1235+1236 |
| Angle | No | Contains the angle used during the run, in degrees. If left blank, ReflectometryReductionOneAuto will calculate theta using SpecularReflectionCalculateTheta. Example: 0.7 |
| Transmission Run(s) | No | Contains the transmission run(s) used to normalise the sample runs. To specify two transmission runs, separate them with a comma. If left blank, the sample runs will be normalised by monitor only. Example: 1234,1235 |
| Q min | No | Contains the minimum value of Q to be used in Å−1. Data with a value of Q lower than this will be discarded. If left blank, this is set to the lowest Q value found. This is useful for discarding noisy data. Example: 0.1 |
| Q max | No | Contains the maximum value of Q to be used in Å−1. Data with a value of Q higher than this will be discarded. If left blank, this is set to the highest Q value found. This is useful for discarding noisy data. Example: 0.9 |
| dQ/Q | No | Contains the resolution used when rebinning output workspaces. If left blank, this is calculated for you using the CalculateResolution algorithm. This value is negated so that Logarithmic binning can be applied for the IvsQ workspace. If you desire linear binning then you may negate the value in the processing table and a linear binning will be applied. Example: 0.9 |
| Scale | No | Contains the factor used to scale output IvsQ workspaces. The IvsQ workspaces are scaled by 1/i where i is the value of this column. Example: 1.0 |
| Options | No | Contains options that allow you to override ReflectometryReductionOne’s properties. To override a property, just use the property’s name as a key, and the desired value as the value. Options are specified in key=value pairs, separated by commas. Values containing commas must be quoted. Options specified via this column will prevail over options specified in the Settings tab. Example: StrictSpectrumChecking=0, RegionOfDirectBeam="0,2", Params="1,2,3" |
_groupSearchPane_widget.png)
To search for runs, select the instrument the runs are from, enter the id of the investigation the runs are part of, and click on Search.
In the table below, valid runs and their descriptions will be listed. You can then transfer runs to the processing table by selecting the runs you wish to transfer, and click the Transfer button. You can also right-click on one of the selected runs and select Transfer in the context menu that appears.
Description based search transfer uses the descriptions associated with raw files from the experiment.
If a run’s description contains the text in 0.7 theta, or th=0.7, or th:0.7, then the interface will deduce that the run’s angle (also known as theta), was 0.7, and enter this value into the angle column for you. This holds true for any numeric value.
When multiple runs are selected and transferred simultaneously, the interface will attempt to organise them appropriately in the processing table. The exact behaviour of this is as follows:
Measure based search transfer uses the log-values within nexus files from the experiment to assemble the batch. Since the files themselves are required, not just the overview metadata, the files must be accessible by mantid. One way of doing this is to mount the archive and set the user property icatDownload.mountPoint to your mount point. It may end up looking something like this icatDownload.mountPoint=/Volumes/inst$. Alternately, you can download the files to your local disk and simply add that directory to the managed search directories in Manage User Directories.
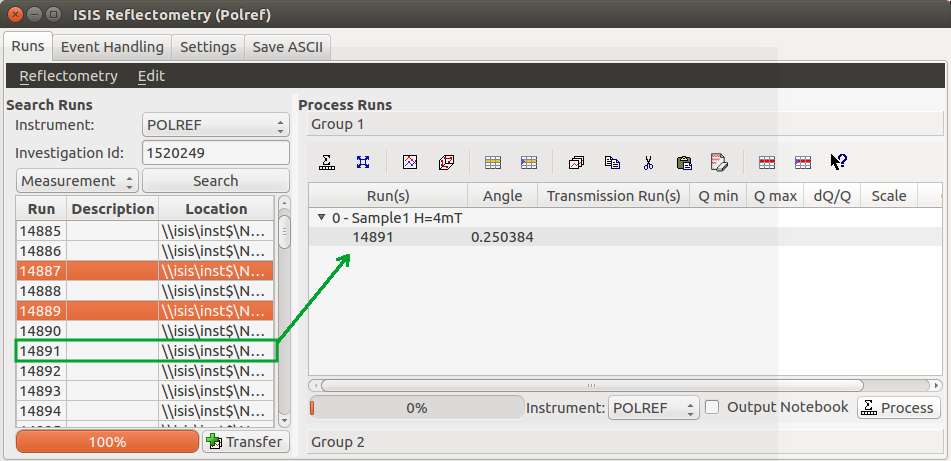
When transferring a run from the Search table to the Processing table there may exist invalid runs. For example, if a Measure-based run has an invalid measurement id. In the image below we select three runs from the Search table that we wish to transfer to the processing table.
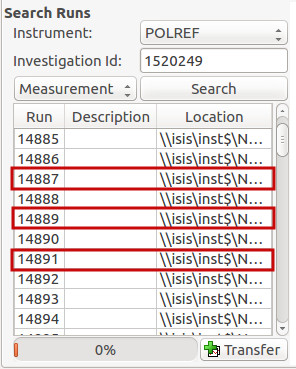
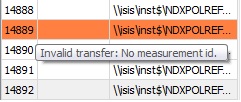
Attempting to transfer an invalid run will result in that run not being transferred to the processing table. If the transfer was not successful then that specific run will be highlighted in the Search table.
Hovering over the highlighted run with your cursor will allow you to see why the run was invalid.
The Event Handling tab can be used to analyze event workspaces. Currently, it contains a text box where a custom python list can be specified to indicate the time slices to analyze. When this text box is empty, no event analysis will be performed, runs will be loaded using LoadISISNexus and analyzed as histogram workspaces. When this text box is not empty, runs will be loaded using LoadEventNexus and the interface will try to parse the user input to obtain a set of start times and stop times. These define different time slices that will be passed on to FilterByTime. Each time slice will be normalized by the total proton charge and reduced as described in the previous section. Note that, if any of the runs in a group could not be loaded as an event workspace, the interface will load the runs within that group as histogram workspaces and no event analysis will be performed for that group. A warning message will be shown when the reduction is complete indicating that some groups could not be processed as event data.
Time slices must be indicated as a list of comma-separated numbers. There are different possibilities:
Workspaces will be named according to the slice, e.g IvsQ_13460_0_100, IvsLam_13460_0_100, etc.
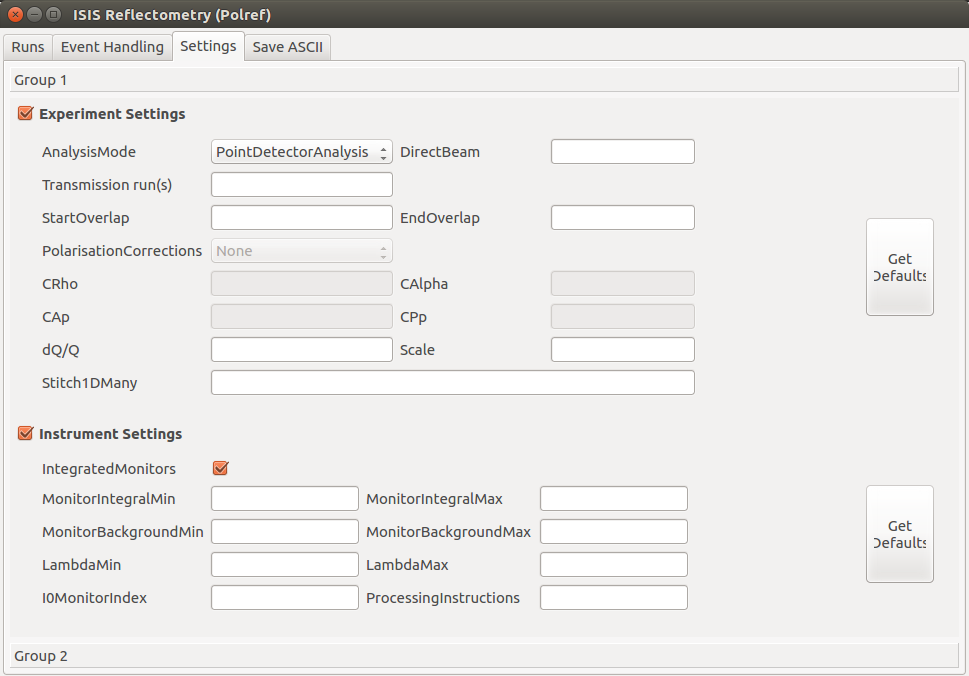
The Settings tab can be used to specify options for the reduction and post-processing. These options are used by the interface to provide argument values for the pre-processing, processing and post-processing algorithms. Each of these respectively refer to the following algorithms:
Note that when conflicting options are specified for the reduction, i.e. different values for the same property are specified via the Settings tab and the Options column in the Runs tab, the latter will prevail. Therefore, the ReflectometryReductionOneAuto settings should be used to specify global options that will be applied to all the rows in the table, whereas the Options column will only be applicable to the specific row for which those options are defined.
The Settings tab is split into two sections, Experiment settings and Instrument settings. The former refers to variables set mostly by the user, while the latter refers to variables set by the instrument used to perform the reduction. Both have a Get Defaults button that fills some of the variables with default values. For experiment settings, these are pulled from the ReflectometryReductionOneAuto algorithm whereas for instrument settings, they are pulled from the current instrument being used in the run.
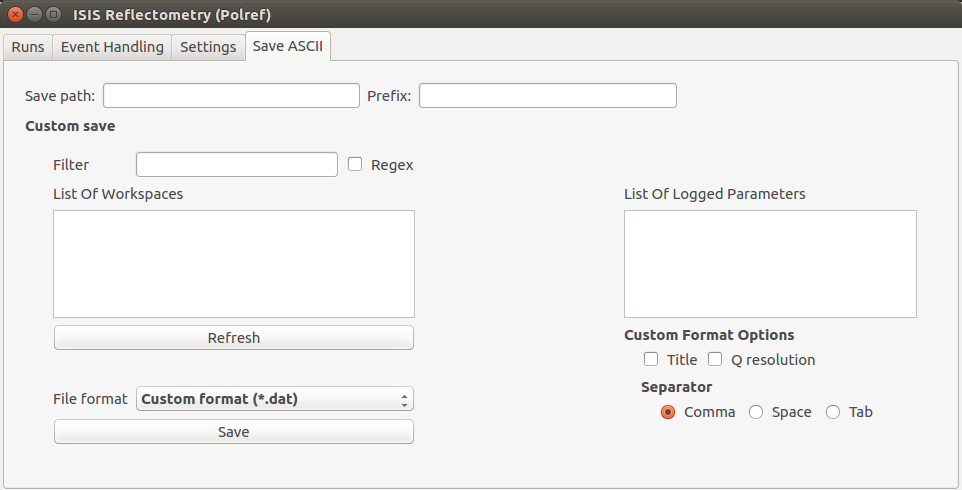
The Save ASCII tab allows for processed workspaces to be saved in specific ASCII formats. The filenames are saved in the form [Prefix][Workspace Name].[ext].
| Name | Description |
|---|---|
| Save path | At present this dialog doesn’t have a standard file dialog so that path must be filled in manually. The path must already exist as this dialog doesn’t have the ability to create directories. As the naming of files is automatic, the path must also point to a directory rather than a file. |
| Prefix | The prefix is what is added to the beginning of the workspace name to create the file name. No underscore or space is added between them so they must be manually added. |
| Filter | This can be specified to filter out workspaces in the workspace list whose name does not match that of the filter text. |
| Regex | Checking this option allows a regular expression to be used for filtering workspace names. |
| List Of Workspaces | The left listbox will contain any workspaces loaded into mantid. Double clicking on one will fill the right list box with the parameters it contains. This listbox supports multi-select in order to allow for multiple workspaces to be saved out at the same time with the same settings. |
| List Of Logged Parameters | The right listbox starts out empty, but will fill with parameter names when a workspace in the left listbox is double clicked. This listbox supports multi-select in order to allow for the save output to contain multiple parameter notes. |
| File format | This dialog can save to ANSTO, ILL cosmos, 3-column, and a customisable format. It doesn’t save from the main interface’s table, but from workspaces loaded into mantid. All algorithms are also available as save algorithms from mantid itself. |
| Custom Format Options | When saving in ‘Custom’ this section allows you to specify if you want a Title and/or Q Resolution column as well as specifying the delimiter. |
Tabs Runs, Event Handling and Settings contain a tool box with two different groups. These groups are useful when users need to apply different options to runs measured during the same experiment. For instance, if some runs need to be analyzed with a wavelength range of LambdaMin=1, LambdaMax=17 but others need a wavelength range of LambdaMin=1.5, LambdaMax=15, users may want to transfer the first set to the processing table in the first group and the second set to the processing table in the second group. The interface will use the settings in the first group to reduce runs in the first processing table, and the settings in the second group to reduce runs in the second processing table. The process is analogous for time slicing options specified in the Event Handling tab.
Through the options menu, a small number of options may be configured to adjust the behaviour of the interface.
To open the options menu, click on Reflectometry -> Options.
| Name | Description |
|---|---|
| Warn when processing all rows | When the Process button is pressed with no rows selected, all rows will be processed. If this is enabled, you will be asked if you’re sure you want to process all rows first. |
| Warn when processing only part of a group | If this is enabled and you press Process with only a subset of a group’s rows selected, you will be asked if you’re sure you that’s what you intended to do. |
| Warn when discarding unsaved changes | If this is enabled and you try to open an existing table, or start a new table, with unsaved changes to the current table, you will be asked if you’re sure you want to discard the current table. |
| Rounding | When a column is left blank, the Reflectometry interface will try to fill it with a sensible value for you. This option allows you to configure whether the value should be rounded, and if so, to how many decimal places. |
This occurs when Mantid is unable to load a run. If the run was given as a workspace name, check the spelling. If the run was given as a number, check that the run number is correct. If the run number is incorrect, check the number given in the Run(s) or Transmission Run(s) columns. If the run number is correct, check the instrument named in the error message is correct. If the instrument is incorrect, check that the processing instrument selector (at the bottom right of the interface) is correct.
If the run still isn’t loading check Mantid’s user directories are set correctly, and that the desired run is in one of the given directories. To manage the user directories, open File -> Manage User Directories.
This occurs when Mantid is unable to stitch a group. Please check that at you have specified at least the bin width. This can be done either by setting a value in column dQ/Q before processing the data, or by using the Stitch1DMany text box in the Settings tab to provide the Params input property like this: Params="-0.03" (you may want to replace 0.03 with a bin size suitable for your reduction). Note that the “-” sign in this case will produce a logarithmic binning in the stitched workspace. For linear binning, use Params="0.03".
This occurs when the contents of the options column are invalid. Key value pairs must be given in the form key = value, and if the value contains commas it must be quoted, like so: key = "v,a,l,u,e".
This occurs when a boolean property is set to “True” or “False”. Please, use 1 or 0 instead.
Stitching is controlled by the group a row is in. For stitching to occur, the rows must be in the same group, and be processed simultaneously.
An easy way to select all the rows in the same group for stitching is to select one of the rows you want stitched, and then in the menu bar select Edit -> Expand Selection. This will select the group your row is in. If you have another row that you would like to add to the group, you can do this easily by adding it to the selection, and then in the menu bar selecting Edit -> Group Selected.
In the old interface (ISIS Reflectometry) the “Save Table” and “Save Table as..” options were used to output a .TBL file into a directory of your choice. This functionality is now provided by the “Export .TBL” option in the Options Menu. This will allow you to save a .TBL file to a directory of your choice. The “Save Table” option in the Options menu now provides a way for you to save the processing table in a TableWorkspace where the name of the TableWorkspace is provided by the user.
Categories: Interfaces | Reflectometry