PoldiAutoCorrelation v5#
Summary#
Performs correlation analysis of POLDI 2D-data.
Properties#
Name |
Direction |
Type |
Default |
Description |
|---|---|---|---|---|
InputWorkspace |
InOut |
Mandatory |
Input workspace containing raw POLDI data. |
|
wlenmin |
Input |
number |
1.1 |
Minimum wavelength considered |
wlenmax |
Input |
number |
5 |
Maximum wavelength considered |
OutputWorkspace |
Output |
Mandatory |
Output workspace containing the correlation spectrum. |
Description#
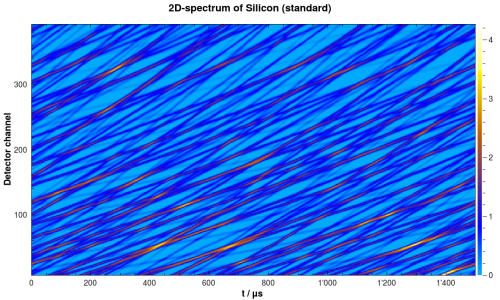
Raw POLDI data for Silicon powder standard. The spectrum is simulated.#
PoldiAutoCorrelation is a core part of the POLDI data analysis process. It takes a 2D-spectrum from POLDI as input, with arrival time \(t\) as x-axis and scattering angle \(2\theta\) as y-axis. In Mantid, the data is represented by a MatrixWorkspace, which contains one spectrum for each \(2\theta\)-value of the detector, each containing usually 500 time-bins.
Without any a-priori information about the sample, a correlation spectrum is calculated, where correlation counts are plotted against \(Q\). Bragg-reflections will appear in this correlation spectrum as well defined peaks, surrounded by a dip which depends on the height of the peak. These spectra may be indexed like powder diffraction diagrams and the extracted peak profile information (location, intensity, FWHM) can be used as starting point for subsequent fits of the raw 2D data. For analysis of the correlaton spectrum, PoldiPeakSearch v1 and PoldiFitPeaks1D v2 can be used.
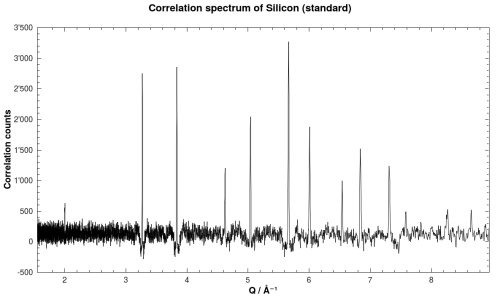
Correlation spectrum of Silicon powder standard.#
A full description of the procedure goes beyond the scope of this documentation. Detailed information about this procedure is available on the POLDI website and more specifically in the paper describing the pulse overlap concept (U. Stuhr, Nuclear Instruments and Methods in Physics Research A 545, S. 319, 2005).
Usage#
Note
To run these usage examples please first download the usage data, and add these to your path. In Mantid this is done using Manage User Directories.
PoldiAutoCorrelation operates on a MatrixWorkspace with a valid POLDI instrument definition. The following short example demonstrates how to use the algorithm, processing data obtained from recording the spectrum of a Silicon standard material (powder).
# Load data file with Si spectrum, this loads the HDF-data into a MatrixWorkspace named raw_6904
raw_6904 = LoadSINQFile(Filename = "poldi2013n006904.hdf", Instrument = "POLDI")

# Print the number of spectra in the workspace. It should be 400, one for each detector wire
print("The workspace contains {} spectra.".format(raw_6904.getNumberHistograms()))

# For most calculations, an instrument definition is needed, so it's loaded as well
LoadInstrument(raw_6904, InstrumentName = "POLDI", RewriteSpectraMap=True)

# Call the actual algorithm.
correlated_6904 = PoldiAutoCorrelation(raw_6904, Version=5)

# The first spectrum contains the correlation data. In this case there should be 5531 bins.
# On other data or different wavelength limits, this number will be different.
print("The correlation spectrum has {} data points.".format(len(correlated_6904.y(0))))
Output:
The workspace contains 400 spectra.
The correlation spectrum has 5531 data points.
Categories: AlgorithmIndex | SINQ\Poldi
Source#
C++ header: PoldiAutoCorrelation5.h
C++ source: PoldiAutoCorrelation5.cpp