ViewBOA v1#
Summary#
Load a BOA file and create the 3 BOA plots.
Properties#
Name |
Direction |
Type |
Default |
Description |
|---|---|---|---|---|
Year |
Input |
number |
2026 |
Choose year |
Numor |
Input |
number |
0 |
Choose file number |
CDDistance |
Input |
number |
6 |
Chopper Detector distance in metres |
Description#
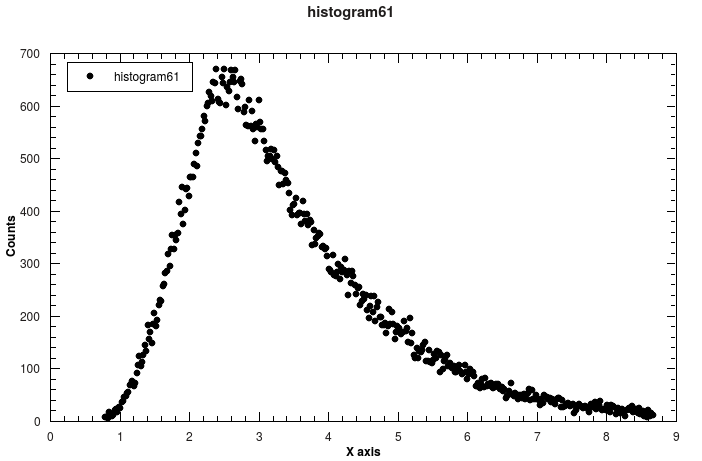
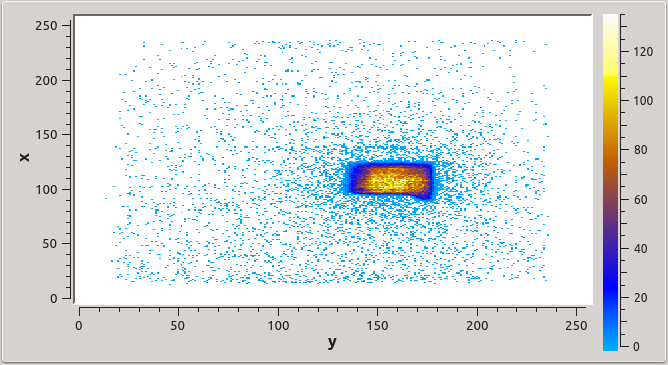
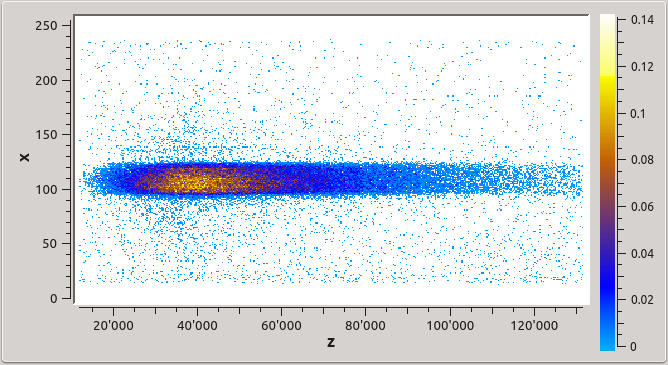
The algorithm loads a BOA file using LoadSINQ v1. It produces three output workspaces, histogram N, ysum N and psdsum N, where N is the numor supplied to ViewBOA.
histogram N contains the wavelength spectrum and can be plotted using “Plot spectrum…”. The other two workspaces can be inspected with the spectrum slice viewer. psdsum N shows a beam profile on the two-dimensional detector, whereas ysum N shows the distribution of events with TOF on the x-axis and the detector x-coordinate on the y-axis, as indicated in the three images below (histogram, psdsum and ysum from left to right).
Usage#
Note
To run these usage examples please first download the usage data, and add these to your path. In Mantid this is done using Manage User Directories.
The following code loads a BOA file and prints out information about the wavelength distribution of the neutrons.
import numpy as np

ViewBOA(2014, 61, 6)

lambda_distribution = mtd['histogram61'].y(0)
lambda_values = mtd['histogram61'].x(0)

print("The wavelength spectrum is described by {} points.".format(len(lambda_distribution)))
print("The range covered is {0} - {1} Angstrom.".format(round(lambda_values[0], 4),round(lambda_values[-1], 4)))
print("The maximum is located at {} Angstrom.".format(round(lambda_values[np.argmax(lambda_distribution)], 4)))
This script leads to the following output:
The wavelength spectrum is described by 400 points.
The range covered is 0.7912 - 8.6638 Angstrom.
The maximum is located at 2.3894 Angstrom.
In addition, the three workspaces described above are available, plotting them should produce figures like the above.
Categories: AlgorithmIndex | SINQ
Source#
Python: ViewBOA.py