Muon Elemental Analysis#
Interface overview#
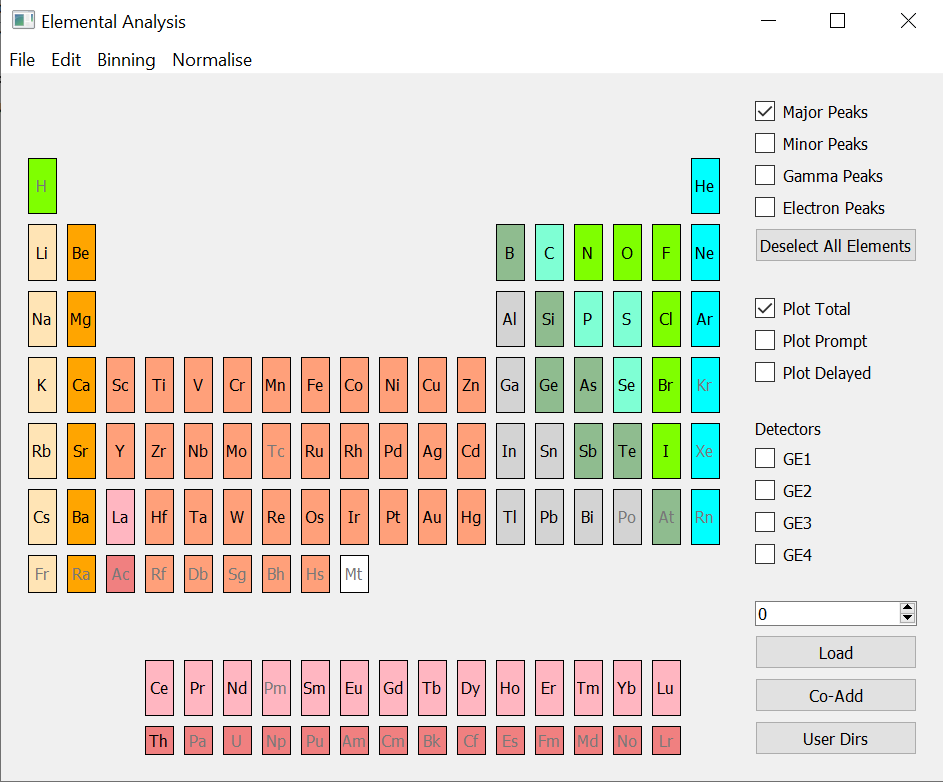
The interface is used to compare data from the Muon detector with the emission spectra of given elements. The interface can be accessed from the main menu in MantidWorkbench and workbench: Interfaces → Muon → Elemental Analysis.
Loading#
Enter a run number (e.g. 6295) and press Load. If the number entered does not correspond to any available run, the program will not load any file, nor return an error.
Plotting#
Tick the boxes corresponding to the detector you want to display. For each detector, a separate plot will appear in the same window. Each plot contains 3 lines: Prompt, Delayed and Total.
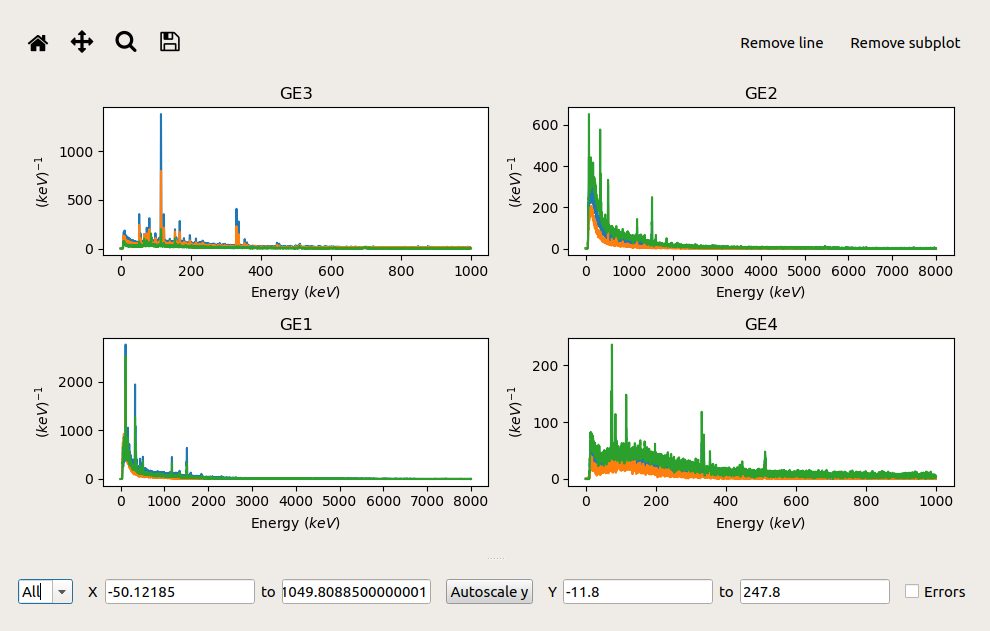
To remove one or more lines on the top right corner of the plot press Remove line, a table will appear. Select the lines you want to remove and press OK. Similarly, to remove one plot press Remove plot, select the plot you wish to remove and press OK.
Displaying peaks#
Elements whose name appears in grey lack any peak data and thus cannot be plotted. To observe the peaks of any other, click on its label which will turn yellow. Now plot data from one of the detectors and select all the peaks you would like to examine: main, secondary, gamma and electronic. Lines will appear for each of the peaks. Lines corresponding to different elements will appear in different colours.
To remove lines from a specific element, click on its label on the periodic table which will return to the original colour.
To remove all the lines from the plots click on Deselect All Elements.
Changing peak data file#
If you wish to load a custom data file for the peaks you can do so from Edit → Change Peak Data File. This will open a window where you can navigate to the position of the datafile you want to load. This has to be a .json file formatted as:
{
  "Ag": {
    "Z": 47,
    "A": 107.87,
    "Primary": {
      "K(4->1)": 3177.7,
      "L(4->2)": 900.7,
      "M(4->3)": 304.7,
      "6->5": 141
    },
    "Secondary": {
      "K(2->1)": 3140.6,
      "L(8->2)": 1347.8,
      "M(10->3)": 567,
      "8->6": 122.2
    },
    "Gammas": {
      "72Ge(n,n')72Ge": 691,
      "73Ge(n,g)74Ge": null,
      "74Ge(n,n')74Ge": 595.7
    }
  }
}
If some peaks are plotted, but the new file lacks data for them, the corresponding lines will disappear. The lines corresponding to peaks of elements present in the new file will remain plotted.
Categories: Interfaces | Muon