What is a Bin?, What is a Workspace? and the Power of Rebin
Most data within Mantid are Histogram-like, so imagine a plot: There is an X-axis with a measured/calculated unit, such as Time-of-Flight (TOF) in μs. The Y-axis is the Counts (How many neutrons / positrons were detected at each TOF value?) and will have the inverse unit of the X-axis, such as μs -1.
But in a Histogram we cut the X-axis into set range blocks, and plot the Total Count (Y) within each block (range in X). Each set range or block is referred to as a “Bin”. The Bins may be of equal length or varying length (see right).
If Algorithms are the verbs of Mantid, then Workspaces are the nouns. Workspaces are used to store data within Mantid, and when you manipulate data, you output to a new Workspace.
Workspaces come in several forms, but the most common two are the Workspace2D and the Event Workspace. Their data are in an XYE format (the general Mantid term is Matrix Workspace) containing 1 or more spectra.
Workspace2D
A Workspace2D is histogrammed data, with one or more spectra. For each spectrum X, Y (counts) and E (error) data is stored.
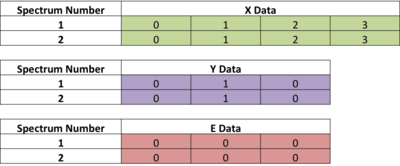
When the Matrix table of a Workspace is displayed (via right-click > “Show Data”): - Each row is a different Spectra. - Each vertical column in X-data is (usually) the edges of each Bin - Each vertical column in Y-data is the number of Counts in that Bin - Each vertical column in E-data is the Error of the Y-data for that Bin
Note as the X-data refers to the Bin boundaries, there is one more column in the X-data, than the Y or E data. (An aside: if the X-data refers to Bin-centers, then it will have the same number of columns as Y and E)
Correct Binning
Where bin boundaries are set along the X-axis determines, how long or short bins are. The overall arrangement of bins for a spectrum is called its binning. Converting units can lead to a ragged workspace, with inconsistent binning between different spectra! A Colorfill plot of ragged data looks poor and often algorithms will not accept a ragged input.
To fix this Rebin the ragged workspace with regular binning:
Load the GEM38370_Focussed.nxs file, naming the OutputWorkspace to be ws
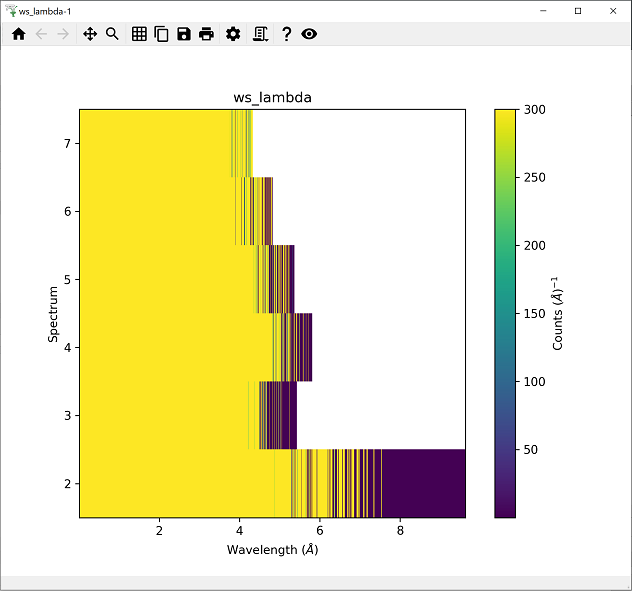
Execute the Algorithm ConvertUnits with ws as the InputWorkspace, ws_lambda as the OutputWorkspace, Target=Wavelength, EMode=Elastic.
Plotting the ws_lambda Workspace as a Colorfill demonstrates the ragged X-bins :-( .
( You may need to alter the max value of the colorbar to around 300 by double-click on the right of the colorbar)
Execute the Rebin Algorithm on ws_lambda setting Params to 0.5 (setting the width of each bin to 0.5 Å) and OutputWorkspace to Rebinned. Plot this as a Colorfill to show uniform binning across all spectra has been achieved! :-)
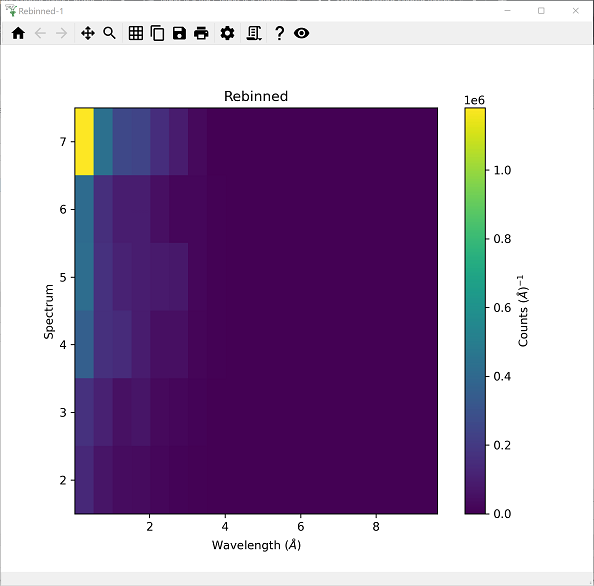
As you can see Rebin is a very useful Algorithm for fixing ragged workspaces. Another important use of rebinning is prior to point-by-point normalisation (e.g. correcting for incident flux and detector efficiency) by normalising to a vanadium run). This is something that may be handled for you if executing an algorithm such as NormaliseToMonitor v1.
Event Workspaces
An Event Workspace stores information about each individual particle detection. More specifically, at a neutron spallation source, this means that the Time of arrival and Detector ID of each individual neutron is recorded. Only fairly recent advances in computer and acquisition hardware have made storing this detailed knowledge a practical solution. For example at the SNS facility all data, except for data collected in monitors, are in Event mode.
Event specifies “when” and “where”
Pulse time – when the proton pulse happened in absolute time
Time-of-flight – time interval for the neutron to travel from moderator to the detector
Binning of Event Workspaces
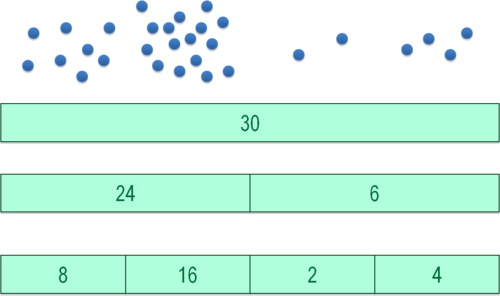
This extra information that Event Data has over Workspace2D (histogram) data means that rebinning is simply moving the Bin edges and summing the number of Counts within the new Bin. While this can be done for Workspace2D (histogram) data, any split bins are averaged.
On the other hand, EventWorkspaces know (to a certain precision) exactly the Time of Arrival value for each particle and so if bins were split they would be split more “correctly”.
Note: If you Execute Rebin on an EventWorkspace AND the PreserveEvents box is not ticked, it will be converted to a Workspace2D.
Performance
Operating on an EventWorkspace is slower than on a Workspace2D, or put more technically:
Each event list is separate
Sorting events is O(n) = n log(n)
Histogramming is O(n) = n
Only convert an EventWorkspace to a Workspace2D (histogram) when performance is a concern.
Example of Workspace usage
Load the event data HYS_11388_event.nxs
Execute the SumSpectra algorithm and output to a sensible workspace name such as “HYS_sum”
Rebin this summed Workspace with Params=10 (the width of each bin) with the box ticked to Preserve Events.
Rebin again to binwidths of 100, 300 and 1000.
Observe, on the plots below, that as the bins get larger, finer detail is “lost”. It’s nice to see rebinning graphically.
Keep these workspace open for the next page.

TableWorkspaces
A Table Workspaces has columns of mixed data, like a spreadsheet. It can store text or calculated/measured values, which may relate to data from an experiment. An example is the output fit parameters from fitting within Mantid.
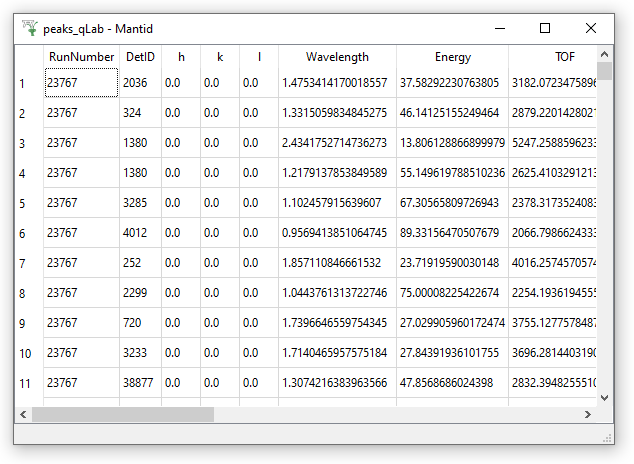
A Peaks Workspace is a special type of TableWorkspace with additional support for Single Crystal peaks. See right for an example of a PeaksWorkspace.
Other Workspace Types
A Workspace Group allows you to organise Workspaces into groups. To create a group simply select more than one workspace in the Workspace Toolbox and click the “Group” button. Either the whole group or individual members can be processed when using algorithms.
MD Workspace is a more complex, multi-dimension type of workspace.