Masking, Grouping and Region of Interest#
The Draw tab is for grouping or masking detectors.
The toolbar on this tab consists of the same tools as the top row of tools in the Pick tab. Their functions and behaviours are also the same but the shapes are used for masking and grouping instead of displaying the data.
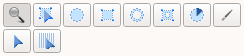
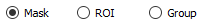
Use these radio-buttons to switch between setting regions as masks, regions of interest, or groups functions.
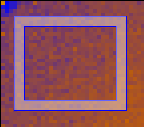
The shapes ready for masking have red border
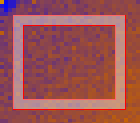
Shapes marked as Regions of Interest have a yellow border

The shapes ready for grouping have blue border
Note : The pixel and tube selections work differently than the shapes: once the tool is selected, the masking or grouping is immediately applied on click on the instrument, while for the grouping, the selected option (Sum to workspace or Extract to workspace) is applied to the last selected pixel / tube only.
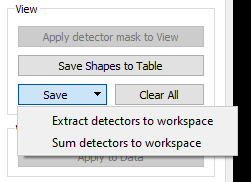
Grouping#
In the grouping mode you can extract the data or save grouping to a file:
Masking#
In the masking mode operations can either be applied to the view only or to the underlying workspace.
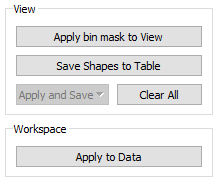
When the “Apply to View” button is clicked the detectors covered by the shapes are greyed out indicating that they are masked.
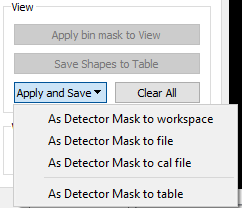
The purpose of applying to view only is to make creation of masking
workspaces/files easier. You can create a mask, apply it to view, save
it in a workspace or a file but then clear the view
( button) and create another mask without closing
the Instrument View or need to reload the data. The masking operations
are available from the “Apply and Save” menu.
button) and create another mask without closing
the Instrument View or need to reload the data. The masking operations
are available from the “Apply and Save” menu.
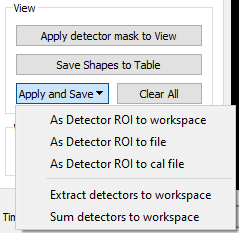
Region of Interest#
Marking a region of interest is essentially masking everything else. It therefore works in a similar way to masking, it can be saved to a workspace or file and it can be applied to the current View or to the underlying Workspace.
Word of Warning: If masking (or setting of ROI) is applied to the data (by clicking  , near the bottom left of Instrument View window)
it cannot be undone!
, near the bottom left of Instrument View window)
it cannot be undone!
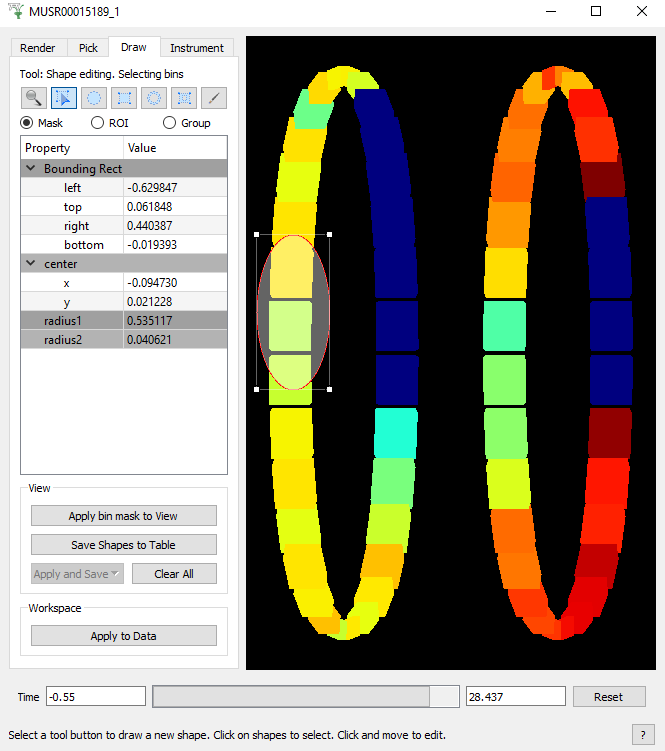
Note that the first button in the View section above is called “Apply bin mask to View”, because it only covers bins within the time range selected on the bottom bar (between -0.55 to 28.47 microseconds). This range bar selects the interval over which instrument view sums/integrates and corresponds to the x-axis of the underlying workspace. This button is called “Apply detector mask to View” when the entire x-axis range is selected as in this way you mask an entire spectrum (and its related detector).
Be aware that any data analysis on spectra from a region of interest (ROI) should not be performed on data in the Pick > mini-plot. You would need to run the DiffractionFocussing v2 algorithm.