Workbench Main Window#
Layout#
When you open Mantid Workbench it will look something like this:
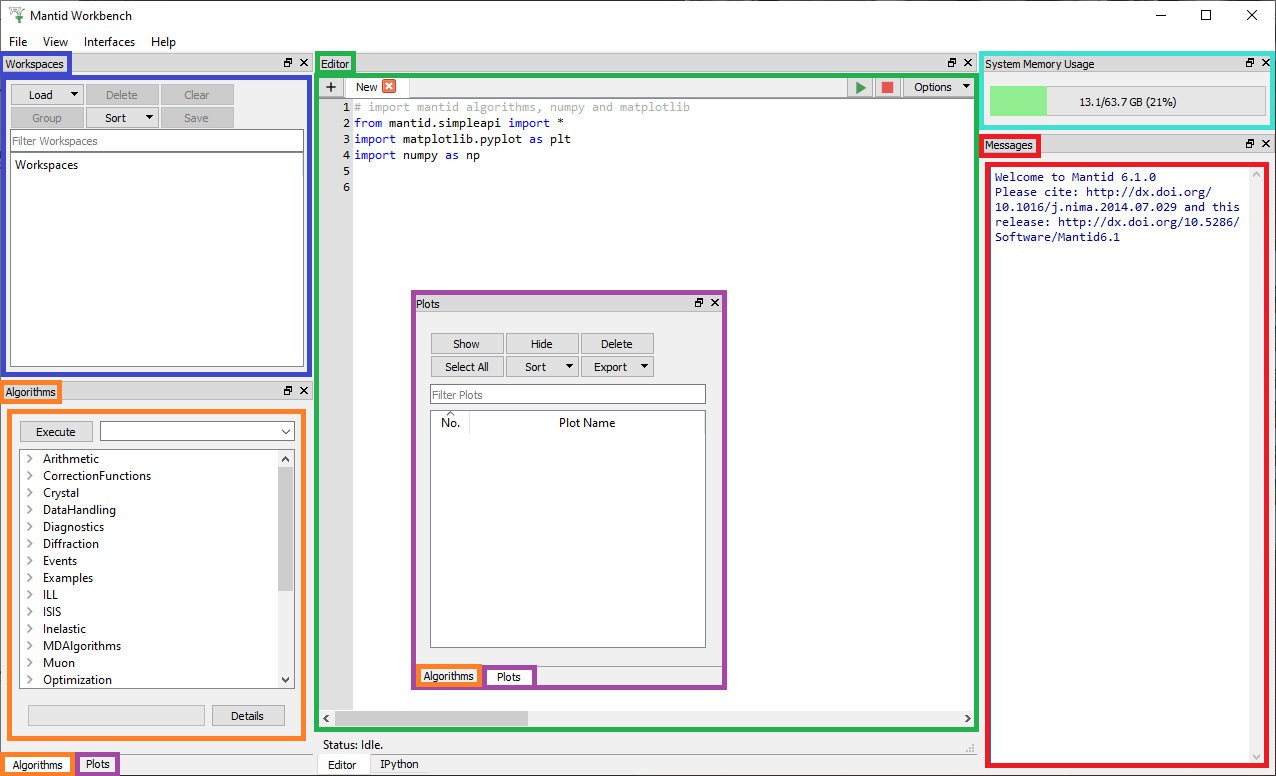
As a quick introduction, the main window contains these Toolboxes:
Workspaces Toolbox: Where data is stored within Mantid, in what we call Workspaces (see later for in-depth explanation).
Algorithms Toolbox: Find an algorithm to manipulate your data.
Plots Toolbox: Click on the Plots button in the bottom-left to reveal this toolbox. When you plot a graph in Workbench, it can be tracked here.
Script Editor: Run Python scripts here to control Mantid. Much more functionality with scripts, but beyond the scope of this basic course.
Messages Box: Any output text, from an algorithm or script. Errors are displayed here in red.
System Memory Usage: Displays the current system memory usage.
Note to find out what Mantid version you are using, look at the first message in the Messages Box. You can see I’m using Mantid 6.1.0.
Note You can click on the top bar of each toolbox and drag it to edit the layout. To reset the layout for MantidWorkbench to the default, go to View > Restore Default Layout.
Quick Intro to Workspaces and Bins#
A workspace is data stored within Mantid. It will appear in the Workspaces Toolbox. When you load a data file, it will create a Workspace. Likewise you can save a Workspace to a file. Many of the features of Mantid perform operations on Workspaces. There are even different types of Workspaces in Mantid, which hold data in different formats.
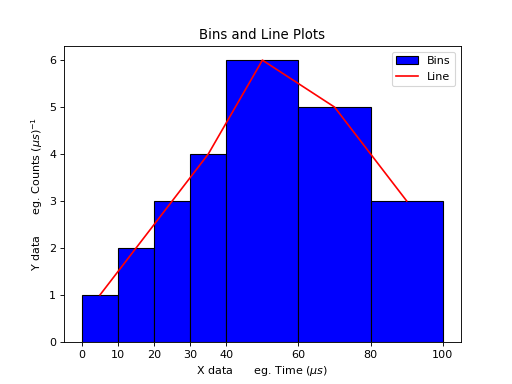
A usual Workspace consists of a number of spectra, each cut into blocks called bins (more about spectra later). Mantid sums the number of counts in each bin and the line we plot connects the top of these bins.
(Note that the bins can have different widths (defined by the instrument set-up)), such as below the bin-widths change from 10 to 20).
(Source code, png, hires.png, pdf)