Extract and Manipulate Data: Examples#
Read vs Extract#
Read produces a view into the chosen part of the original data.
Extract creates a copy of this part of the data.
Read#
Using a loop, read and print the first value in all spectra
for index in range(0, raw_workspace.getNumberHistograms()):
    #Note the round brackets followed by the square brackets
    print(raw_workspace.y(index)[0])
Workspace data can be read as numpy arrays, spectrum by spectrum:
ws = Load(Filename="HRP39182.RAW")
for i in range(ws.getNumberHistograms()):
    y = ws.y(i)
    x = ws.x(i)
    e = ws.e(i)
Warning#
Be careful: the outputs of read (y,x,e) are only views into the data held by the workspace, ws. If ws is deleted, the contents of x,y,e will be invalid (the random contents of the memory locations formerly used for ws). If you need x,y,e data to persist longer than the workspace, use the extract methods, which create a copy of the data in ws into y,x,e.
Extract#
The data from all spectra can be obtained as a mutable multi-dimensional array in one-call using the extract methods.
ws = Load(Filename="HRP39182.RAW")
x = ws.extractX()
y = ws.extractY()
e = ws.extractE()

print(x.shape)
print(y.shape)
print(e.shape)
Since the extract methods return multi-dimensional numpy arrays. So to use extract in a similar way to read, you need to slice these arrays with indexing.
E.g. instead of ws.x(5) you should use:
ws.extractX()[5, :]

xmat = ws.extractX(); x = xmat[5, :]
Nested Looping#
This allows access to the individual bins in each spectrum. E.g. to sum the y-values in each spectrum:
ws = Load(Filename="HRP39182.RAW")
ws = Rebin(InputWorkspace=ws, Params=1e4) # Rebin to make the looping more manageable.
# Outer loop. Loop over spectrum
for i in range(ws.getNumberHistograms()):
    y = ws.y(i)
    sum_counts = 0
    # Inner loop. Loop over bins.
    for j in range(ws.blocksize()):
        sum_counts += y[j]
    # Display spectrum number against sum_counts
    print("Spectrum Number: {0}, Total Counts: {1}".format(ws.getSpectrum(i).getSpectrumNo(), sum_counts))
Creating Output Workspaces#
We may perform some processing on the data arrays before creating our new workspace.
Creating a MatrixWorkspace#
Use CreateWorkspace v1, with the correct input arrays.
E.g. Change the x-axis for TOF from microseconds to milliseconds:
from mantid.simpleapi import *
import matplotlib.pyplot as plt
import numpy as np
from mantid.plots._compatability import plotSpectrum
# Load and Read data
ws = Load(Filename="HRP39182.RAW")
x = ws.x(0)
y = ws.y(0)
e = ws.e(0)
# Alter the x data
new_x = x * 1e-3
# Create a new Matrix Workspace with the altered data
new_ws = CreateWorkspace(DataX=new_x, DataY=y, DataE=e, NSpec=1,UnitX='Label')
# Set the Label for the AxisUnit
unit = new_ws.getAxis(0).getUnit()
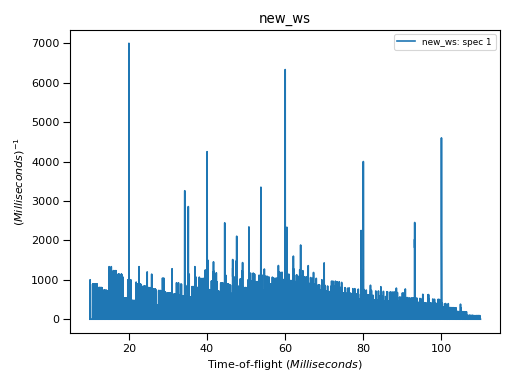
unit.setLabel("Time-of-flight", "Milliseconds")
# Plot the new workspace
plotSpectrum(new_ws,0)
(Source code, png, hires.png, pdf)
Creating a TableWorkspace#
Use CreateEmptyTableWorkspace v1 and addColumn() and addRow() as needed. Refer back to TableWorkspace with Python
E.g. To read out the value in the first bin for each spectrum:
ws = Load(Filename="GEM40979.RAW")

table = CreateEmptyTableWorkspace()
table.addColumn('int', 'Spectrum Number')
table.addColumn('double', 'First Bin Value')

for i in range(ws.getNumberHistograms()):

    specNumber = ws.getSpectrum(i).getSpectrumNo()

    # read each spectrum, just the first bin
    y = ws.y(i)[0]

    table.addRow([specNumber,y])