Python in Mantid: Solution 1#
All the data for these solutions can be found in the TrainingCourseData on the Downloads page.
A - Using ISIS Data#
from mantid.simpleapi import *
# The input data set
inputData = "HRP39182"
# Load the file
Load(Filename=inputData+".RAW",OutputWorkspace=inputData,Cache="If Slow")
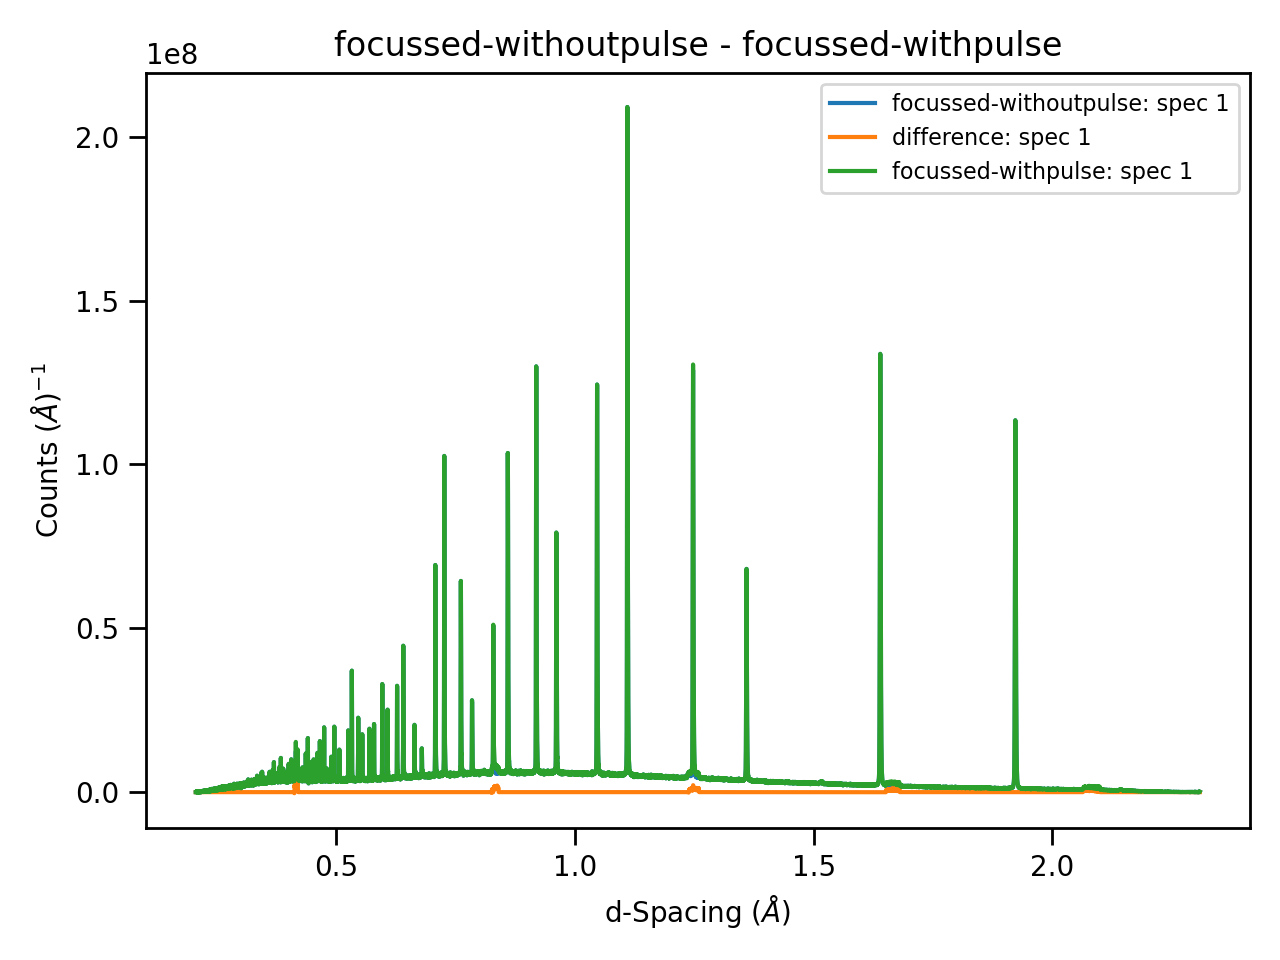
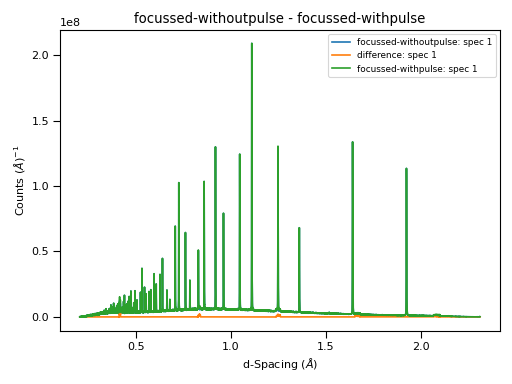
# First do the analysis without prompt pulse removal so that we can compare the difference
cal_file = "hrpd_new_072_01_corr.cal"
ApplyDiffCal(InstrumentWorkspace=inputData, CalibrationFile=cal_file)
ConvertUnits(InputWorkspace=inputData, OutputWorkspace="aligned-withpulse", Target="dSpacing")
# Focus the data
DiffractionFocussing(InputWorkspace="aligned-withpulse",OutputWorkspace="focussed-withpulse",GroupingFileName=cal_file)
# Remove the prompt pulse, which occurs at at 20,000 microsecond intervals. The bin width comes from a quick look at the data
for i in range(0,5):
min = 19990 + (i*20000)
max = 20040 + (i*20000)
MaskBins(InputWorkspace=inputData,OutputWorkspace=inputData,XMin=min,XMax=max)
ApplyDiffCal(InstrumentWorkspace=inputData, CalibrationFile=cal_file)
ConvertUnits(InputWorkspace=inputData, OutputWorkspace="aligned-withoutpulse", Target="dSpacing")
# Focus the data
DiffractionFocussing(InputWorkspace="aligned-withoutpulse",OutputWorkspace="focussed-withoutpulse",GroupingFileName=cal_file)
# Subract the processed data with and without pulse from eachother
Minus(LHSWorkspace="focussed-withpulse", RHSWorkspace="focussed-withoutpulse", OutputWorkspace="difference")
# Now plot a focussed spectrum with and without prompt peak removal so that you can see the difference
plotSpectrum(["focussed-withoutpulse","difference", "focussed-withpulse"],0)
(Source code, png, hires.png, pdf)
B - SNS Data#
Right-click in the Messages toolbox and check that the log level is set to “Notice” (or lower, such as “Information” and “Debug”).
from mantid.simpleapi import *

run = Load('PG3_4871_event')
nevents = run.getNumberEvents()
logger.notice('Number of Events Before = {}'.format(str(nevents)))
filtered = FilterBadPulses(run, LowerCutoff=99.5)
ApplyDiffCal(InstrumentWorkspace=filtered, CalibrationFile='PG3_golden.cal')
aligned = ConvertUnits(InputWorkspace=filtered, Target="dSpacing")

rebinned = Rebin(InputWorkspace=aligned, Params=[1.4,-0.0004, 8])
focused = DiffractionFocussing(InputWorkspace=rebinned, GroupingFileName='PG3_golden.cal')
compressed = CompressEvents(InputWorkspace=focused)
nevents = compressed.getNumberEvents()
logger.notice('Number of Events After = {}'.format(str(nevents)))
Output:
Number of Events Before = 22065736
Number of Events After = 555305
C - ILL Data#
For point 5., you are expected to open the docs page for ConvertUnits v1 and notice that EFixed should be set to the Ei value (Found in Show Sample Logs). This docs page also mentions that for Ei, the parameter EMode=’Direct’ is required. These parameters are required by the target of the unit conversion - DeltaE.
from mantid.simpleapi import *

# You can load each file individually, e.g.
# 164198 = Load(Filename=164198)
# ... for each file

# Or you can Load data in a loop, but you may need to import the workspaces to Python
for i in range(164198,164201):
    print( '{}.nxs'.format(i))
    Load(Filename = '{}.nxs'.format(i), OutputWorkspace = str(i))

mtd.importAll()

data_merged = MergeRuns([164198,164199,164200])
bad_spectra = [1,2,3,4,5,6,11,14,30,69,90,93,95,97,175,184,190,215,216,217,251,252,253,255,289,317,335,337]
MaskDetectors(Workspace = data_merged, SpectraList = bad_spectra)
scaled = MultiplyRange(data_merged, Factor = 0.95)
ws = ConvertUnits(scaled, Target = 'DeltaE', EFixed = 4.7728189558864003, EMode = 'Direct') # See explanation above
wsCorrected = DetectorEfficiencyCorUser(ws)

print("The corrected value in spectrum with ws index {}, bin {} is {:.2f} compared to {:.2f}".format(6,4,wsCorrected.y(6)[4],ws.y(6)[4]))
Output:
The corrected value in spectrum number 6, bin 4 is 278.85 compared to 0.95