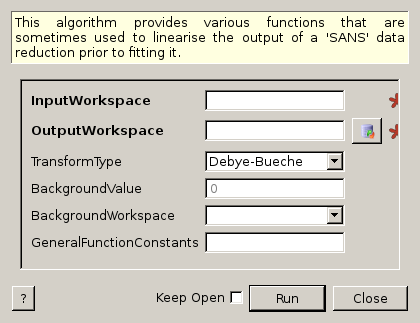
IQTransform dialog.
Table of Contents
This algorithm provides various functions that are sometimes used to linearise the output of a ‘SANS’ data reduction prior to fitting it.
| Name | Direction | Type | Default | Description |
|---|---|---|---|---|
| InputWorkspace | Input | MatrixWorkspace | Mandatory | The input workspace must be a distribution with units of Q |
| OutputWorkspace | Output | MatrixWorkspace | Mandatory | The name of the output workspace |
| TransformType | Input | string | Mandatory | The name of the transformation to be performed on the workspace. Allowed values: [‘Debye-Bueche’, ‘General’, ‘Guinier (rods)’, ‘Guinier (sheets)’, ‘Guinier (spheres)’, ‘Holtzer’, ‘Kratky’, ‘Log-Log’, ‘Porod’, ‘Zimm’] |
| BackgroundValue | Input | number | 0 | A constant value to subtract from the data prior to its transformation |
| BackgroundWorkspace | Input | MatrixWorkspace | A workspace to subtract from the input workspace prior to its transformation.Must be compatible with the input (as for the Minus algorithm). | |
| GeneralFunctionConstants | Input | dbl list | A set of 10 constants to be used (only) with the ‘General’ transformation |
This algorithm is intended to take the output of a SANS reduction and apply a transformation to the data in an attempt to linearise the curve. Optionally, a background can be subtracted from the input data prior to transformation. This can be either a constant value, another workspace or both. Note that this expects a single spectrum input; if the input workspace contains multiple spectra, only the first will be transformed and appear in the output workspace.
A SANS reduction results in data in the form I(Q) vs Q, where Q is Momentum Transfer and I denotes intensity (the actual unit on the Y axis is 1/cm). These abbreviations are used in the descriptions of the transformations which follow. If the input is a histogram, the mid-point of the X (i.e. Q) bins will be taken. The output of this algorithm is always point data.
| Transformation Name | Y | X |
|---|---|---|
| Guinier (spheres) |  |
 |
| Guinier (rods) |  |
|
| Guinier (sheets) |  |
|
| Zimm |  |
|
| Debye-Bueche |  |
|
| Holtzer |  |
 |
| Kratky |  |
|
| Porod |  |
|
| Log-Log |  |
 |
| General [*] |  |
 |
| [*] | The constants  are, in subscript order, the ten constants passed to the GeneralFunctionConstants property. are, in subscript order, the ten constants passed to the GeneralFunctionConstants property. |
Example - Zimm transformation:
x = [1,2,3]
y = [1,2,3]
input = CreateWorkspace(x,y)
input.getAxis(0).setUnit("MomentumTransfer")
input.setDistribution(True)

output = IQTransform(input, 'Zimm')

print 'Output Y:', output.readY(0)
print 'Output X:', output.readX(0)
Output:
Output Y: [ 1.          0.5         0.33333333]
Output X: [ 1.  4.  9.]
Example - Zimm transformation and background:
x = [1,2,3]
y = [1,2,3]
input = CreateWorkspace(x,y)
input.getAxis(0).setUnit("MomentumTransfer")
input.setDistribution(True)

output = IQTransform(input, 'Zimm', BackgroundValue=0.5)

print 'Output Y:', output.readY(0)
print 'Output X:', output.readX(0)
Output:
Output Y: [ 2.          0.66666667  0.4       ]
Output X: [ 1.  4.  9.]
Example - General transformation:
import math

x = [1,2,3]
y = [1,2,3]
input = CreateWorkspace(x,y)
input.getAxis(0).setUnit("MomentumTransfer")
input.setDistribution(True)

constants = [2,2,0,0,math.e,3,0,0,0,math.e]
output = IQTransform(input, 'General', GeneralFunctionConstants=constants)

print 'Output Y:', output.readY(0)
print 'Output X:', output.readX(0)
Output:
Output Y: [  1.  16.  81.]
Output X: [  1.   8.  27.]
Categories: Algorithms | SANS