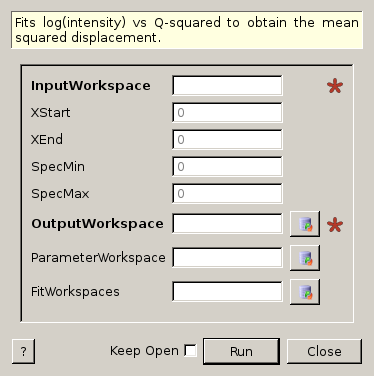
MSDFit dialog.
Table of Contents
| Name | Direction | Type | Default | Description |
|---|---|---|---|---|
| InputWorkspace | Input | MatrixWorkspace | Mandatory | Sample input workspace |
| XStart | Input | number | 0 | Start of fitting range |
| XEnd | Input | number | 0 | End of fitting range |
| SpecMin | Input | number | 0 | Start of spectra range to be fit |
| SpecMax | Input | number | 0 | End of spectra range to be fit |
| OutputWorkspace | Output | MatrixWorkspace | Mandatory | Output mean squared displacement |
| ParameterWorkspace | Output | TableWorkspace | Output fit parameters table | |
| FitWorkspaces | Output | WorkspaceGroup | Output fitted workspaces |
Fits  vs
vs  with a straight line for each run
to obtain the mean square displacement for a given range of runs.
with a straight line for each run
to obtain the mean square displacement for a given range of runs.
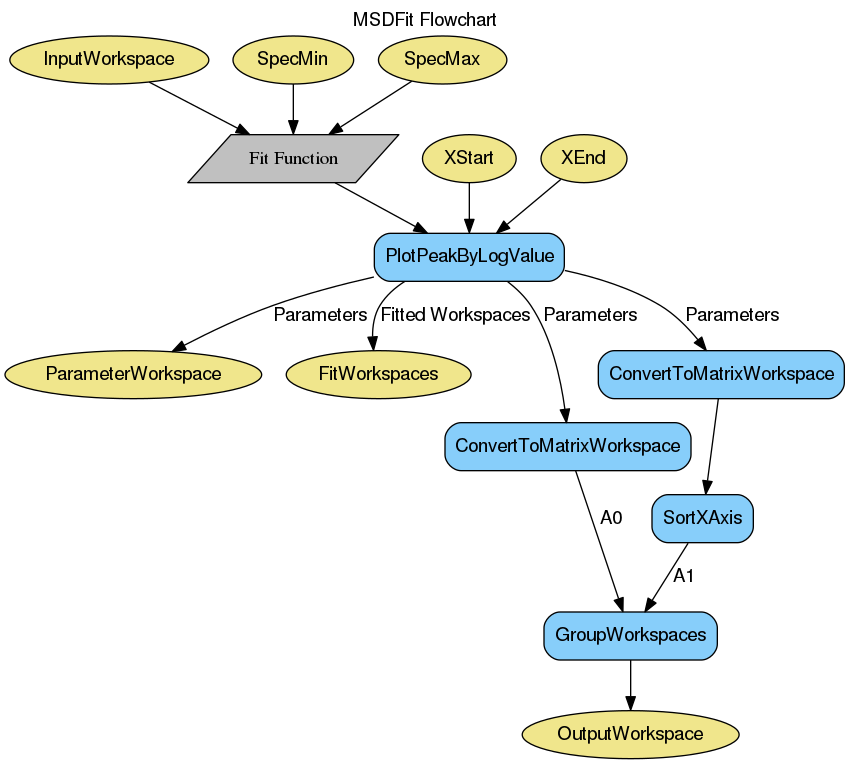
This algorithm operates on the QSquared workspace (_q2) generated by the ElasticWindowMultiple algorithm.
Example - Performing MSDFit on simulated data.
# Create some data that is similar to the output of ElasticWindowMultiple
sample = CreateSampleWorkspace(Function='User Defined',
                UserDefinedFunction='name=ExpDecay,Height=1,Lifetime=6',
                NumBanks=1, BankPixelWidth=1, XUnit='QSquared', XMin=0.0,
                XMax=5.0, BinWidth=0.1)

msd, param, fit = MSDFit(InputWorkspace=sample,
                         XStart=0.0, XEnd=5.0,
                         SpecMin=0, SpecMax=0)

print 'A0: ' + str(msd.readY(0))
print 'A1: ' + str(msd.readY(1))
Output:
A0: [ 0.95908058]
A1: [ 0.11014908]
Categories: Algorithms | Workflow\MIDAS