StripVanadiumPeaks dialog.
Table of Contents
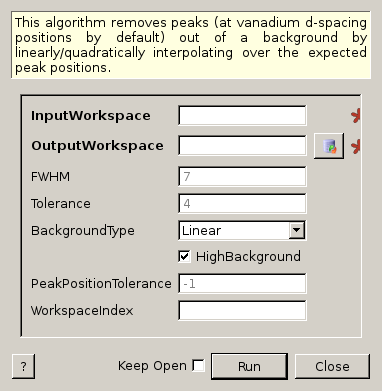
This algorithm removes peaks (at vanadium d-spacing positions by default) out of a background by linearly/quadratically interpolating over the expected peak positions.
| Name | Direction | Type | Default | Description |
|---|---|---|---|---|
| InputWorkspace | Input | MatrixWorkspace | Mandatory | Name of the input workspace. If you use the default vanadium peak positions are used, the workspace must be in units of d-spacing. |
| OutputWorkspace | Output | MatrixWorkspace | Mandatory | The name of the workspace to be created as the output of the algorithm. If the input workspace is an EventWorkspace, then the output must be different (and will be made into a Workspace2D). |
| FWHM | Input | number | 7 | The number of points covered, on average, by the fwhm of a peak. Passed through to FindPeaks. Default 7. |
| Tolerance | Input | number | 4 | A measure of the strictness desired in meeting the condition on peak candidates. Passed through to FindPeaks. Default 4. |
| BackgroundType | Input | string | Linear | The type of background of the histogram. Present choices include Linear and Quadratic. Allowed values: [‘Linear’, ‘Quadratic’] |
| HighBackground | Input | boolean | True | Flag to indicate that the peaks are relatively weak comparing to background |
| PeakPositionTolerance | Input | number | -1 | Tolerance on the found peaks’ positions against the input peak positions. A non-positive value turns this option off. |
| WorkspaceIndex | Input | number | Optional | If set, peaks will only be removed from this workspace index (otherwise from all) |
This is a wrapper for StripPeaks v1 algorithm used with the peak positions for Vanadium.
Note
To run these usage examples please first download the usage data, and add these to your path. In MantidPlot this is done using Manage User Directories.
Example:
ws = Load("PG3_733.nxs")
wsOut = StripVanadiumPeaks(ws,BackgroundType="Linear",WorkspaceIndex=2)
i = 1529
print "This peak at %.4f Angstroms has been reduced from %.0f to a background level of %.0f" % (wsOut.readX(2)[i],ws.readY(2)[i], wsOut.readY(2)[i])
Output:
This peak at 0.8116 Angstroms has been reduced from 11569 to a background level of 10771
Categories: Algorithms | CorrectionFunctions\PeakCorrections | Optimization\PeakFinding | Diffraction\Corrections