Table of Contents
These are unscripted tests for the Muon Analysis interface. The tests here in group 3 are concerned with generating results tables from fits that have previously been run. In this case, the fits previously run are those in test group 2, so those tests need to be run before these ones.
The master testing guide is located at Muon Interfaces Unscripted Testing.
Ensure that you have first run all the tests in group 2, then go to the Results Table tab.
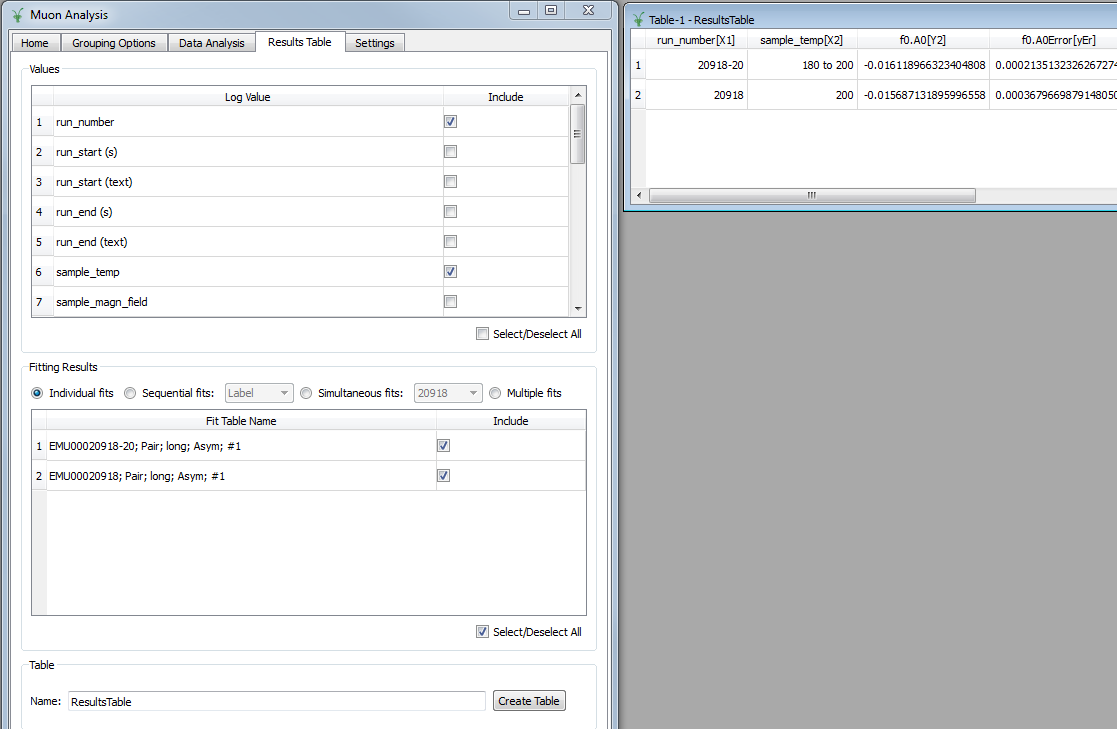
Like this:
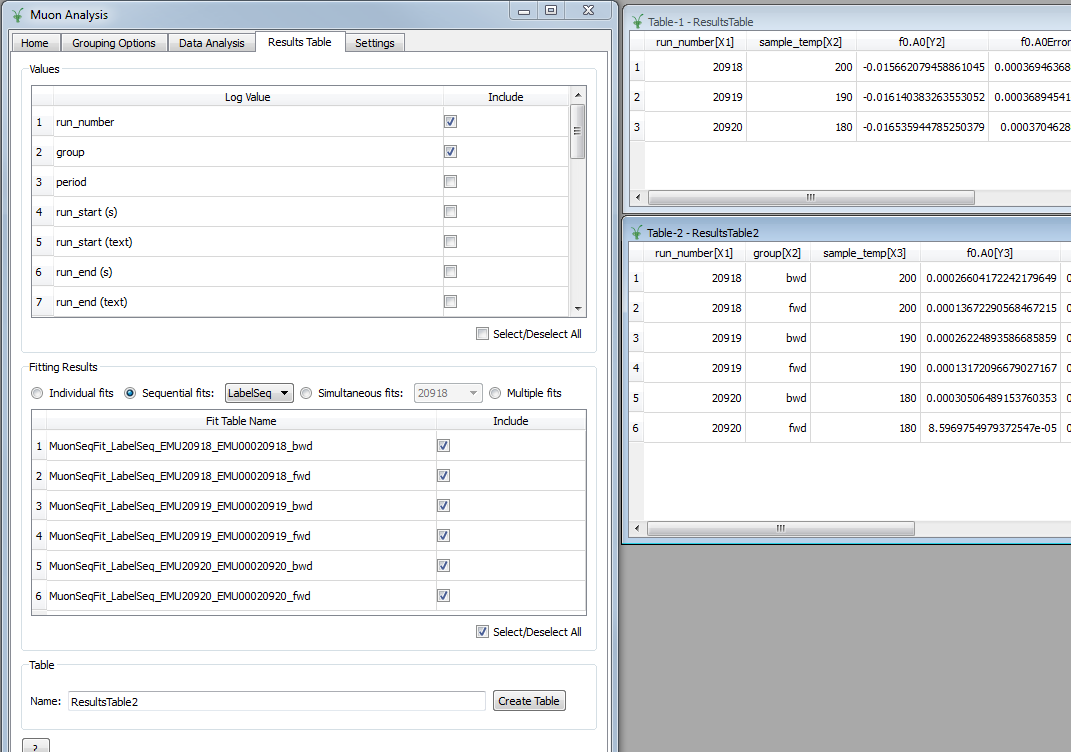
Like this:
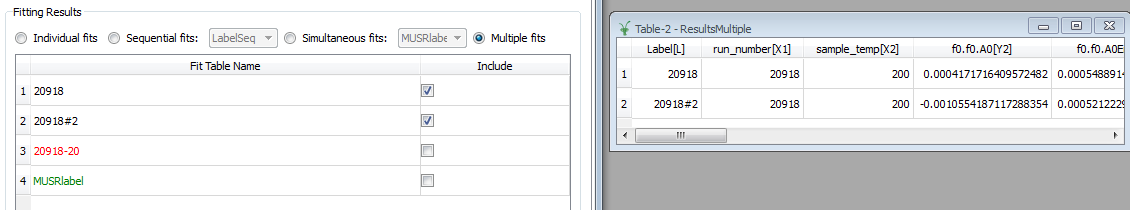
Should look like this:
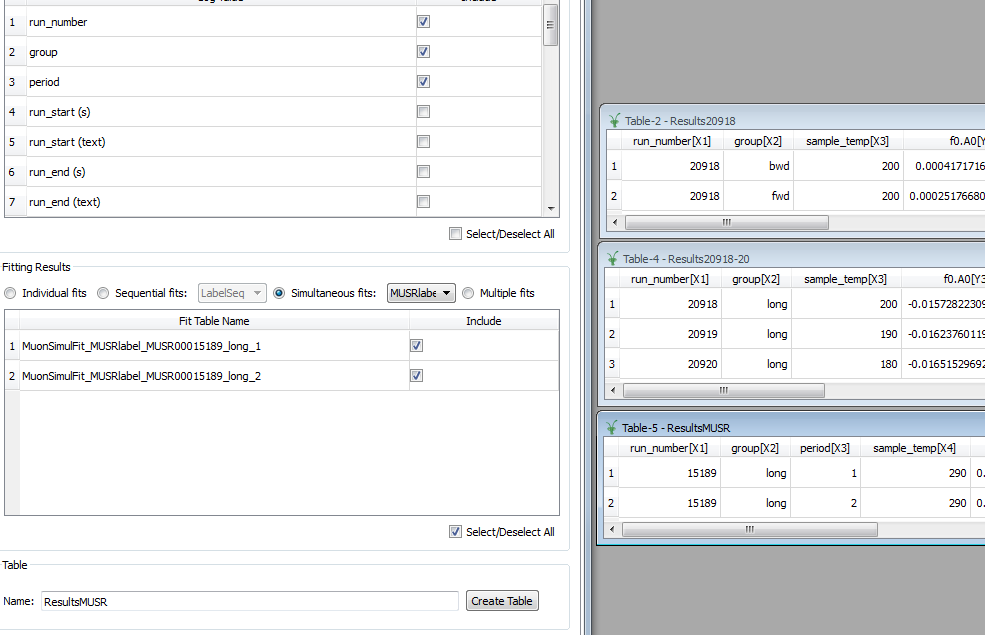
Should look like this: