Table of Contents
Calculates instrument count rate as the function of the experiment time and adds CountRate log to the source workspace.
| Name | Direction | Type | Default | Description |
|---|---|---|---|---|
| Workspace | InOut | EventWorkspace | Mandatory | Name of the event workspace to calculate counting rate for. |
| XMin | Input | number | Optional | Minimal value of X-range for the rate calculations. If left to default, Workspace X-axis minimal value is used. |
| XMax | Input | number | Optional | Maximal value of X-range for the rate calculations. If left to default, Workspace X-axis maximal value is used. |
| RangeUnits | Input | string | Energy | The units from Mantid Unit factory for calculating the counting rate and XMin-XMax ranges are in. If the X-axis of the input workspace is not expressedin these units, unit conversion will be performed, so the workspace should contain all necessary information for this conversion. E.g. if RangeUnits is EnergyTransfer, Ei log containing incident energy value should be attached to the input workspace. See ConvertUnits algorithm for the details. Allowed values: [‘Degrees’, ‘DeltaE’, ‘DeltaE_inFrequency’, ‘DeltaE_inWavenumber’, ‘dSpacing’, ‘dSpacingPerpendicular’, ‘Empty’, ‘Energy’, ‘Energy_inWavenumber’, ‘Label’, ‘Momentum’, ‘MomentumTransfer’, ‘QSquared’, ‘SpinEchoLength’, ‘SpinEchoTime’, ‘Time’, ‘TOF’, ‘Wavelength’] |
| EMode | Input | string | Elastic | The energy mode for ‘RangeUnits’ conversion mode (default: elastic). Allowed values: [‘Elastic’, ‘Direct’, ‘Indirect’] |
| NormalizeTheRate | Input | boolean | True | Usually you want to normalize counting rate to some rate related to the source beam intensity. Change this to ‘false’ if appropriate time series log is broken || not attached to the input workspace. |
| UseLogDerivative | Input | boolean | False | If the normalization log contains cumulative counting, derivative of this log is necessary to get correct normalization values. |
| NormalizationLogName | Input | string | proton_charge | The name of the log, used in the counting rate normalization. |
| CountRateLogName | Input | string | block_count_rate | The name of the processed time series log with instrument count rate to be added to the source workspace |
| UseNormLogGranularity | Input | boolean | True | If true, the count rate log will have the normalization log accuracy; If false, the ‘NumTimeSteps’ in the visualization workspace below will be used for the target log granularity too. |
| VisualizationWs | Output | MatrixWorkspace | Optional name to build 2D matrix workspace for spurion visualization. If name is provided, a 2D workspace with this name will be created containing data to visualize counting rate as function of time in the ranges XMin-XMax | |
| NumTimeSteps | Input | number | 200 | Number of time steps (time accuracy) the visualization workspace has. Also number of steps in ‘CountRateLogName’ log if ‘UseNormLogGranularity’ is set to false. Should be bigger than 3 |
| XResolution | Input | number | 100 | Number of steps (accuracy) of the visualization workspace has along X-axis. |
The algorithm works with event workspaces produced by instruments operating in event mode and calculates the rate at which an instrument counts neutrons as function of the experiment time. Then it adds the time series log containing this rate, with the name, defined by CountRateLogName property to the source workspace.
Additionally it can also calculate 2D matrix workspace, which contains count rate as function of experiment time and neutrons time of flight or energy or other neutron property related to the time of flight in the range XMin-XMax in the units defined by RangeUnits property.
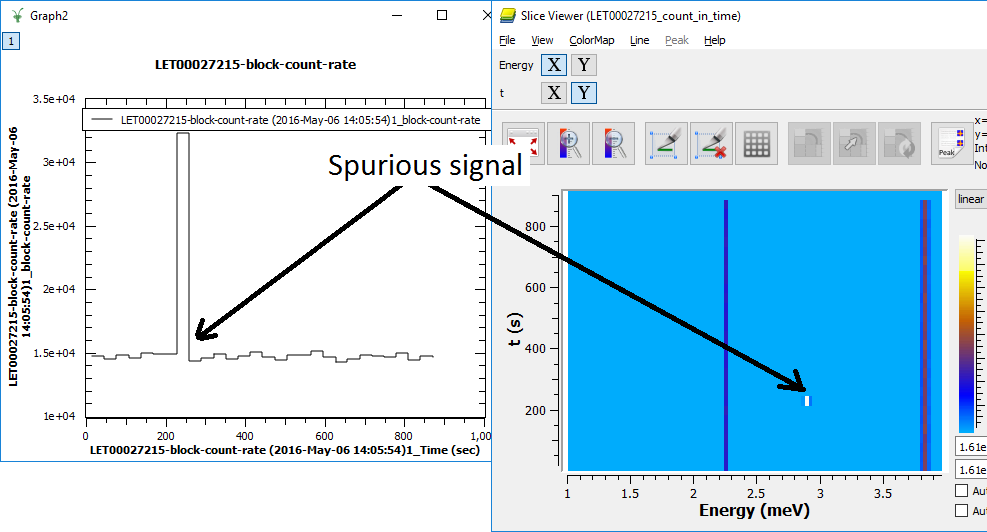
In normal circumstances the instrument count rate does not change. Unfortunately, Data Acquisition Electronics sometimes randomly generates spurious signals, appearing randomly at some moments of the experiment time. Such signals distort real physical image, obtained in experiment and should be removed.
The picture below gives example of counting rate log, calculated by the algorithm together with image of the visualization workspace, which shows the spurious signal as function of experiment time and neutron energy.

The calculated log above can be used as input for FilterByLogValue v1 algorithm to filter events recorded around 200sec of experiment time to remove spurious signal at 2.9mEv.
The algorithm can also be used to evaluate changes of sample reflectivity as function of some slow changing experiment’s parameter e.g. temperature, magnetic field or pressure.
NOTE: Normally one wants to divide the count rate by a value, proportional to incident neutron flux to avoid count rate dependency from changing incident beam intensity. Usually algorithm just divides the neutron counts by proton_charge log values, normally recorded per frame basis. If this log is not available, other logs can be used to estimate incident beam intensity. Visualization workspace is usually calculated with much more coarse time step than the count_rate log, so the normalization used in visualization workspace is just the sum of all values of the log used for normalization falling within the visualization time step.
Example - Calculate Count Rate
if "LogTest" in mtd:
    DeleteWorkspace("LogTest")
# Create sample workspace with events
LogTest=CreateSampleWorkspace(WorkspaceType='Event', Function='Flat background')
log_name = 'block_count_rate';

# no rate log found:
rez = CheckForSampleLogs(LogTest,log_name)
print("Initially, {0}".format(rez))

# calculate number of events in the workspace
CalculateCountRate(LogTest,CountRateLogName= log_name)

rez = CheckForSampleLogs(LogTest,log_name)
if len(rez)==0:
     print("The Algorithm produced log: {0}".format(log_name))
     log = LogTest.run().getLogData(log_name)
     print("log {0} contains {1} entries".format(log_name, log.size()))
     print("log starts at {0} and records value: {1}".format(log.firstTime(), log.firstValue()))
     print("log ends   at {0} and records value: {1}".format(log.lastTime(), log.lastValue()))
else:
    print("{0}".format(rez))
Initially, Property block_count_rate not found
The Algorithm produced log: block_count_rate
log block_count_rate contains 200 entries
log starts at 2010-01-01T00:00:09.011891145  and records value: 991.0
log ends   at 2010-01-01T00:59:50.996493194  and records value: 1010.0
Categories: Algorithms | Inelastic\Utility | Diagnostics | Events\EventFiltering
C++ source: CalculateCountRate.cpp (last modified: 2018-03-07)
C++ header: CalculateCountRate.h (last modified: 2018-03-07)