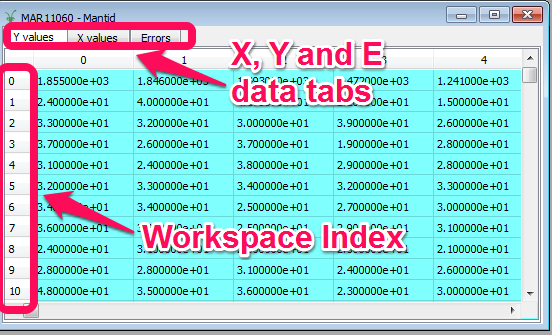
Workspace Matrix View
To inspect the data in a workspace, one can open the matrix view in one of the few ways:
- Click and drag the workspace name into the main window area (the grey bit in the middle).
- Right click the workspace name and select show data.
- Double click the workspace name.

Each row in the matrix shows the data of a single spectrum. By flipping between the tabs you can see the X, Y and E values:
- X contains the bin boundaries for histogram data or bin centre values for point data.
- Y contains the counts corresponding to each bin or point of the spectrum.
- E contains the errors associated with the counts. For most raw data this will initially be the square root of Y on loading.
Spectra that correspond to monitor detectors are marked with light yellow background.
The masked spectra or bins will be highlighted with light grey background.
