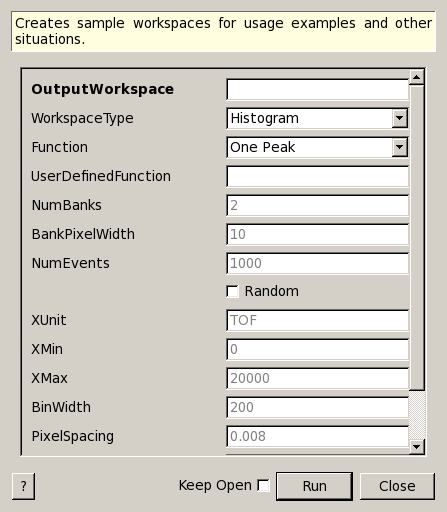
CreateSampleWorkspace dialog.
Table of Contents
| Name | Direction | Type | Default | Description |
|---|---|---|---|---|
| OutputWorkspace | Output | MatrixWorkspace | Mandatory | An output workspace. |
| WorkspaceType | Input | string | Histogram | The type of workspace to create (default: Histogram). Allowed values: [‘Histogram’, ‘Event’] |
| Function | Input | string | One Peak | Preset options of the data to fill the workspace with. Allowed values: [‘Exp Decay’, ‘Flat background’, ‘Multiple Peaks’, ‘One Peak’, ‘Powder Diffraction’, ‘Quasielastic’, ‘Quasielastic Tunnelling’, ‘User Defined’] |
| UserDefinedFunction | Input | string | Parameters defining the fitting function and its initial values | |
| NumBanks | Input | number | 2 | The Number of banks in the instrument (default:2) |
| BankPixelWidth | Input | number | 10 | The number of pixels in horizontally and vertically in a bank (default:10) |
| NumEvents | Input | number | 1000 | The number of events per detector, this is only used for EventWorkspaces (default:1000) |
| Random | Input | boolean | False | Whether to randomise the placement of events and data (default:false) |
| XUnit | Input | string | TOF | The unit to assign to the XAxis (default:”TOF”) |
| XMin | Input | number | 0 | The minimum X axis value (default:0) |
| XMax | Input | number | 20000 | The maximum X axis value (default:20000) |
| BinWidth | Input | number | 200 | The bin width of the X axis (default:200) |
| PixelSpacing | Input | number | 0.008 | The spacing between detector pixels in M (default:0.008) |
| BankDistanceFromSample | Input | number | 5 | The distance along the beam direction from the sample to bank in M (default:5.0) |
| SourceDistanceFromSample | Input | number | 10 | The distance along the beam direction from the source to the sample in M (default:10.0) |
Creates sample workspaces for usage examples and other situations.
You can select a predefined function for the data or enter your own by selecting User Defined in the drop down.
The data will be the same for each spectrum, and is defined by the function selected, and a little noise if Random is selected. All values are taken converted to absolute values at present so negative values will become positive. For event workspaces the intensity of the graph will be affected by the number of events selected.
Here is an example of a user defined formula containing two peaks and a background.:
"name=LinearBackground, A0=0.5;
name=Gaussian, PeakCentre=10000, Height=50, Sigma=0.5;
name=Gaussian, PeakCentre=1000, Height=80, Sigma=0.5"
Random also affects the distribution of events within bins for event workspaces. If Random is selected the results will differ between runs of the algorithm and will not be comparable. If comparing the output is important set Random to false or uncheck the box.
Note
For the Quasielastic and Quasielastic Tunnelling presets the XMin and XMax values should be set to a range symmetrical around x=0.
The instrument created by CreateSample workspace is very simple and looks like this.
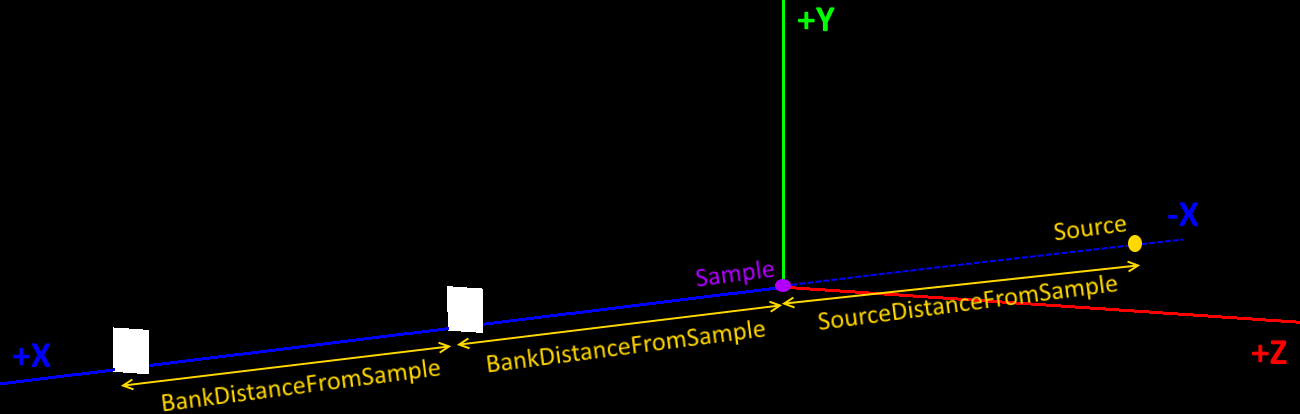
The sample is placed at the origin. The source is seperated from the sample in the negative direction by the vlue you specify in “SourceDistanceFromSample”. The instrument has “NumBanks” detector banks, each bank is moved down the X axis by “BankDistanceFromSample” from the Sample or the previous bank.
Each bank is a square rectangular bank comprising of “BankPixelWidth” pixels in width and height. The size of each pixel 4mm square, but additional padding can be set using “PixelSpacing”.
Example - create a simple histogram workspace:
# create histogram workspace
ws = CreateSampleWorkspace()

print "Number of spectra: " +  str(ws.getNumberHistograms())
print "Number of bins: " +  str(ws.blocksize())
print "Each spectra has a level backgound of " + str(ws.readY(0)[0]) + \
 " counts and a peak in the centre of " + str(ws.readY(0)[50]) + " counts."
Output:
Number of spectra: 200
Number of bins: 100
Each spectra has a level backgound of 0.3 counts and a peak in the centre of 10.3 counts.
Example - create a simple event workspace:
# create event workspace
ws = CreateSampleWorkspace("Event")

print "Number of spectra: " +  str(ws.getNumberHistograms())
print "Number of bins: " +  str(ws.blocksize())
print "Number of events: " +  str(ws.getNumberEvents())
print "Event Workspaces come with bins set by default to a bin width of " + str(ws.readX(0)[1]-ws.readX(0)[0])
#The data itensity of an EventWorkspce is scaled by the number of events used, so the values differ from the histogram above.
print "Each spectra has a level backgound of " + str(ws.readY(0)[0]) + \
     " counts and a peak in the centre of " + str(ws.readY(0)[50]) + " counts."
Output:
Number of spectra: 200
Number of bins: 100
Number of events: 190000
Event Workspaces come with bins set by default to a bin width of 200.0
Each spectra has a level backgound of 7.0 counts and a peak in the centre of 257.0 counts.
Example - Using the preset functions:
# create a workspace with Flat Background
wsFlat = CreateSampleWorkspace("Histogram","Flat background")
print "Flat background has a constant value of " + str(wsFlat.readY(0)[0]) + " counts."

# create a workspace with multiple peaks
wsMulti = CreateSampleWorkspace("Histogram","Multiple Peaks")
print "Multiple Peaks has a level backgound of " + str(wsMulti.readY(0)[0]),
print "counts and two gaussian peaks, the largest of which is " + str(wsMulti.readY(0)[60]) + " counts."

# create a workspace with Exponential Decay
wsExp = CreateSampleWorkspace("Histogram","Exp Decay")
print ("Exp Decay starts high and drops rapidly to %.2f counts at 8,000 us (with the default binning)." % wsExp.readY(0)[40])
Output:
Flat background has a constant value of 1.0 counts.
Multiple Peaks has a level backgound of 0.3 counts and two gaussian peaks, the largest of which is 8.3 counts.
Exp Decay starts high and drops rapidly to 0.03 counts at 8,000 us (with the default binning).
Example - Using the your own function:
# create a workspace with data defined using the function string below
myFunc = "name=LinearBackground, A0=0.5;name=Gaussian, PeakCentre=10000, Height=50, Sigma=0.5;name=Gaussian, PeakCentre=1000, Height=80, Sigma=0.5"

ws = CreateSampleWorkspace("Histogram","User Defined",myFunc)

print "My function defined a background of "+ str(ws.readY(0)[0]) + " counts."
print "With a peak reaching "+ str(ws.readY(0)[5]) + " counts at 1,000 us,"
print "and another reaching "+ str(ws.readY(0)[50]) + " counts at 10,000 us."
Output:
My function defined a background of 0.5 counts.
With a peak reaching 80.5 counts at 1,000 us,
and another reaching 50.5 counts at 10,000 us.
Example - Quasielastic:
ws=CreateSampleWorkspace(Function="Quasielastic",
                         XUnit="DeltaE",
                         XMin=-0.5,
                         XMax=0.5,
                         BinWidth=0.01)

print "Number of spectra: " +  str(ws.getNumberHistograms())
print "Number of bins: " +  str(ws.blocksize())
Output:
Number of spectra: 200
Number of bins: 100
Example - Setting every Option:
#Random adds a little random noise to the data function
ws=CreateSampleWorkspace(WorkspaceType="Event",Function="One Peak",NumBanks=4,BankPixelWidth=5,NumEvents=500,Random=True,XUnit="tof",XMin=0, XMax=8000, BinWidth=100)

print "Number of spectra: " +  str(ws.getNumberHistograms())
print "Number of bins: " +  str(ws.blocksize())
Output:
Number of spectra: 100
Number of bins: 80
Categories: Algorithms | Utility\Workspaces