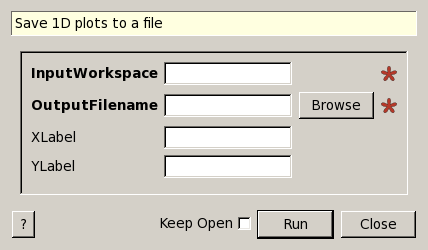
SavePlot1D dialog.
Table of Contents
| Name | Direction | Type | Default | Description |
|---|---|---|---|---|
| InputWorkspace | Input | Workspace | Mandatory | Workspace to plot |
| OutputFilename | Input | string | Mandatory | Name of the image file to savefile. Allowed values: [‘png’] |
| XLabel | Input | string | Label on the X axis. If empty, it will be taken from workspace | |
| YLabel | Input | string | Label on the Y axis. If empty, it will be taken from workspace |
Save 1D plots to a png file, as part of autoreduction. Multiple spectra in the same workspace will be represented by curves on the same plot. Groupped workspaces will be shown as subplots. If the workspace has more than one spectra, but less or equal to ten, labels will be shown.
Note
The figures contain lines between points, no error bars.
Note
Requires matplotlib version>= 1.2.0
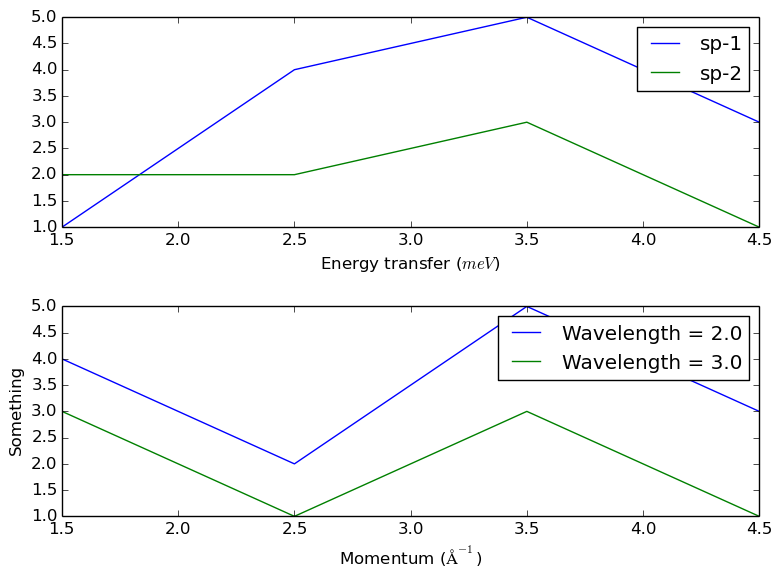
#create some workspaces
CreateWorkspace(OutputWorkspace='w1',DataX='1,2,3,4,5,1,2,3,4,5',DataY='1,4,5,3,2,2,3,1',DataE='1,2,2,1,1,1,1,1',NSpec='2',UnitX='DeltaE')
CreateWorkspace(OutputWorkspace='w2',DataX='1,2,3,4,5,1,2,3,4,5',DataY='4,2,5,3,3,1,3,1', DataE='1,2,2,1,1,1,1,1',NSpec='2',UnitX='Momentum',VerticalAxisUnit='Wavelength',VerticalAxisValues='2,3',YUnitLabel='Something')
wGroup=GroupWorkspaces("w1,w2")

#write to a file
try:
    import mantid
    filename=mantid.config.getString("defaultsave.directory")+"SavePlot1D.png"
    SavePlot1D(InputWorkspace=wGroup,OutputFilename=filename)
except:
    pass
Output:
The file should look like
Categories: Algorithms | DataHandling\Plots
Python: SavePlot1D.py