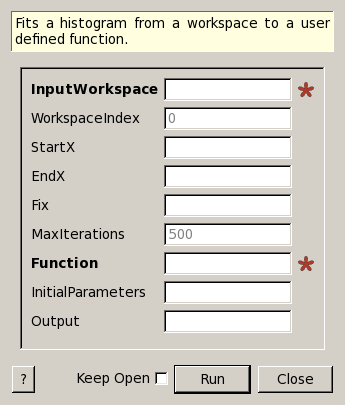
UserFunction1D dialog.
Table of Contents
| Name | Direction | Type | Default | Description |
|---|---|---|---|---|
| InputWorkspace | Input | MatrixWorkspace | Mandatory | Name of the input Workspace |
| WorkspaceIndex | Input | number | 0 | The Workspace to fit, uses the workspace numbering of the spectra (default 0) |
| StartX | Input | number | Optional | A value of x in, or on the low x boundary of, the first bin to include in the fit (default lowest value of x) |
| EndX | Input | number | Optional | A value in, or on the high x boundary of, the last bin the fitting range (default the highest value of x) |
| Fix | Input | string | A list of comma separated parameter names which should be fixed in the fit | |
| MaxIterations | Input | number | 500 | Stop after this number of iterations if a good fit is not found |
| OutputStatus | Output | string | ||
| OutputChi2overDoF | Output | number | ||
| Function | Input | string | Mandatory | The fit function |
| InitialParameters | Input | string | The comma separated list of initial values of the fit parameters in the form varName=value | |
| Output | Input | string | If not empty OutputParameters TableWorksace and OutputWorkspace will be created. |
This algorithm fits a spectrum to a user defined function. The function is supplied to the algorithm as a text string. The function here is a mathematical expression using numbers, variable names and internal function names. Symbols ‘+’, ‘-‘, ‘*’, ‘/’, and ‘^’ can be used for arithmetic operations. Names can contain only letters, digits, and the underscore symbol ‘_’. The internal functions are:
| Name | Argc. | Explanation |
|---|---|---|
| sin | 1 | sine function |
| cos | 1 | cosine function |
| tan | 1 | tangens function |
| asin | 1 | arcus sine function |
| acos | 1 | arcus cosine function |
| atan | 1 | arcus tangens function |
| sinh | 1 | hyperbolic sine function |
| cosh | 1 | hyperbolic cosine |
| tanh | 1 | hyperbolic tangens function |
| asinh | 1 | hyperbolic arcus sine function |
| acosh | 1 | hyperbolic arcus tangens function |
| atanh | 1 | hyperbolic arcur tangens function |
| log2 | 1 | logarithm to the base 2 |
| log10 | 1 | logarithm to the base 10 |
| log | 1 | logarithm to the base 10 |
| ln | 1 | logarithm to base e (2.71828...) |
| exp | 1 | e raised to the power of x |
| sqrt | 1 | square root of a value |
| sign | 1 | sign function -1 if x<0; 1 if x>0 |
| rint | 1 | round to nearest integer |
| abs | 1 | absolute value |
| if | 3 | if ... then ... else ... |
| min | var. | min of all arguments |
| max | var. | max of all arguments |
| sum | var. | sum of all arguments |
| avg | var. | mean value of all arguments |
An example of Function property is “a + b*x + c*x^2”. Variable x is used to represent the values of the X-vector of the input spectrum. All other variable names are treated as fitting parameters. A parameter can be given an initial value in the InitialParameters property. For example, “b=1, c=0.2”. The order in which the variables are listed is not important. If a variable is not given a value, it is initialized with 0.0. If some of the parameters should be fixed in the fit list them in the Fix property in any order, e.g. “a,c”.
The resulting parameters are returned in a TableWorkspace set in OutputParameters property. Also for displaying purposes OutputWorkspace is returned. It contains the initial spectrum, the fitted spectrum and their difference.
In this example the fitting function is a*exp(-(x-c)^2*s). The parameter s is fixed.
Categories: Algorithms | Optimization\FitAlgorithms