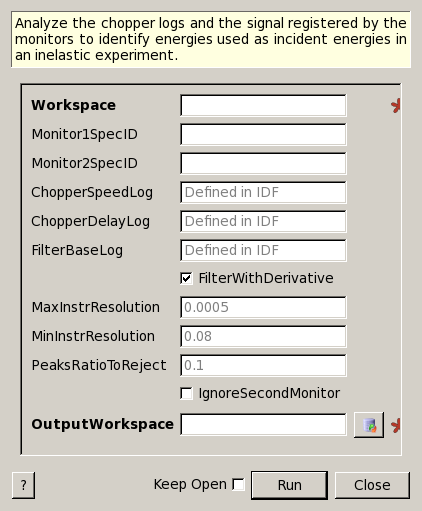
GetAllEi dialog.
Table of Contents
Analyze the chopper logs and the signal registered by the monitors to identify energies used as incident energies in an inelastic experiment.
| Name | Direction | Type | Default | Description |
|---|---|---|---|---|
| Workspace | Input | MatrixWorkspace | Mandatory | The input workspace containing the monitor’s spectra measured after the last chopper |
| Monitor1SpecID | Input | number | Optional | The workspace index (ID) of the spectra, containing first monitor’s signal to analyze. |
| Monitor2SpecID | Input | number | Optional | The workspace index (ID) of the spectra, containing second monitor’s signal to analyze. |
| ChopperSpeedLog | Input | string | Defined in IDF | Name of the instrument log, containing chopper angular velocity. If ‘Defined in IDF’ option is specified, the log name is obtained from the IDF |
| ChopperDelayLog | Input | string | Defined in IDF | Name of the instrument log, containing chopper delay time or chopper phase v.r.t. the pulse time. If ‘Defined in IDF’ option is specified, the log name is obtained from IDF |
| FilterBaseLog | Input | string | Defined in IDF | Name of the instrument log, with positive values indicating that instrument is running and 0 or negative that it is not. The log is used to identify time interval to evaluate chopper speed and chopper delay which matter. If such log is not present, average log values are calculated within experiment start&end time range. |
| FilterWithDerivative | Input | boolean | True | Use derivative of ‘FilterBaseLog’ rather then log values itself to filter invalid time intervals. Invalid values are then the values where the derivative of the log turns zero. E.g. the ‘proton_chage’ log grows for each frame when instrument is counting and is constant otherwise. |
| MaxInstrResolution | Input | number | 0.0005 | The maximal energy resolution possible for an instrument at working energies (full width at half maximum). Peaks, sharper then this width are rejected. Accepted limits are: 1e^(-6)-0.1 |
| MinInstrResolution | Input | number | 0.08 | The minimal energy resolution possible for an instrument at working energies (full width at half maximum). Peaks broader then this width are rejected. Accepted limits are: 0.001-0.5 |
| PeaksRatioToReject | Input | number | 0.1 | Ratio of a peak energy to the maximal energy among all peaks. If the ratio is lower then the value specified here, peak is treated as insignificant and rejected. Accepted limits are:0.0 (All accepted) to 1 – only one peak (or peaks with max and equal intensity) are accepted. |
| IgnoreSecondMonitor | Input | boolean | False | Usually peaks are analyzed and accepted only if identified on both monitors. If this property is set to true, only first monitor peaks are analyzed. This is debugging option as getEi has to use both monitors. |
| OutputWorkspace | Output | Workspace | Mandatory | Name of the output matrix workspace, containing single spectra with monitor peaks energies together with total intensity within each peak. |
Algorithm finds the estimate for all incident energies allowed by chopper system of an inelastic instrument and returns a workspace, with the estimates for positions, heights and width of incident energies provided by the choppers and registered on monitors. These estimates can be used as guess value for GetEi v2 algorithm or as inputs for a peak fitting procedure.
Algorithm performs number of steps to identify the values requested:
Algorithm returns matrix workspace containing single spectrum, with x-values representing peak positions, y-values: peak heights and the error: peak width. X-values are sorted according to energy in peaks (peaks with maximal energy are returned first).
The algorithm uses Unit Factory and ConvertUnits v1 algorithm to convert units from TOF to energy.
Example: Find all incident energies for test workspace
# BUILD SAMPLE WORKSPACE
# Build sample workspace with chopper and in energy units to
# have defined peaks in defined energy positions
wsEn=CreateSampleWorkspace(Function='Multiple Peaks', NumBanks=1, BankPixelWidth=2, NumEvents=10000, XUnit='Energy', XMin=10, XMax=200, BinWidth=0.1)
# convert units to TOF to simulate real workspace obtained from experiment
ws = ConvertUnits(InputWorkspace=wsEn, Target='TOF')
# find chopper log values would be present in real workspace
l_chop = 7.5  # chopper position build into test workspace
l_mon1 = 15. # monitor 1 position (detector 1), build into test workspace
t_mon1 = 3100. # the time of flight defined by incident energy of the peak generated by CreateSampelpWorkspace algorithm.
t_chop = (l_chop/l_mon1)*t_mon1
# Add these log values to simulated workspace to represent real sample logs
AddTimeSeriesLog(ws, Name="fermi_delay", Time="2010-01-01T00:00:00", Value=t_chop ,DeleteExisting=True)
AddTimeSeriesLog(ws, Name="fermi_delay", Time="2010-01-01T00:30:00", Value=t_chop )
AddTimeSeriesLog(ws, Name="fermi_speed", Time="2010-01-01T00:00:00", Value=900 ,DeleteExisting=True)
AddTimeSeriesLog(ws, Name="fermi_speed", Time="2010-01-01T00:30:00", Value=900)
#-------------------------------------------------------------

# FIND GUESS PEAKS
allEiWs=GetAllEi(ws,Monitor1SpecID=1,Monitor2SpecID=2)
# Analyze results
allEi = allEiWs.readX(0);
peakHeight = allEiWs.readY(0);
peakWidth  = allEiWs.readE(0);

# Check if peaks positions are indeed correct:
#-------------------------------------------------------------
resEi=[]
for ei_guess in allEi:
   nop,t_peak,monIndex,tZero=GetEi(InputWorkspace=ws, Monitor1Spec=1, Monitor2Spec=2, EnergyEstimate=ei_guess)
   resEi.append((nop,t_peak));
print "! Guess Ei ! peak TOF ! peak height ! peak width !"
for ind,val in enumerate(resEi):
   print "!  {0: >6.1f}  !  {1: >6.2f} !   {2: >6.2f}    ! {3: >6.2f}     !".format(allEi[ind],val[1],peakHeight[ind],peakWidth[ind])
#
# NOTE: incident energy of GetEi is calculated from distance between monitor 1 and 2, and this distance is not correct in
# the test workspace. The tested point is that getEi can find energies from guess values and TOF for peaks is correct.
Output:
! Guess Ei ! peak TOF ! peak height ! peak width !
!    67.0  !  4188.03 !    34.68    !   2.35     !
!   124.1  !  3079.09 !    14.01    !   4.35     !
Categories: Algorithms | Inelastic\Ei