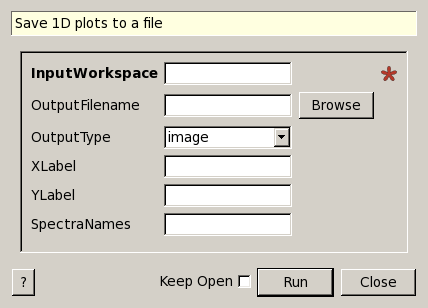
SavePlot1D dialog.
Table of Contents
| Name | Direction | Type | Default | Description |
|---|---|---|---|---|
| InputWorkspace | Input | Workspace | Mandatory | Workspace to plot |
| OutputFilename | Input | string | Name of the image file to savefile. Allowed extensions: [‘.png’] | |
| OutputType | Input | string | image | Method for rendering plot. Allowed values: [‘image’] |
| XLabel | Input | string | Label on the X axis. If empty, it will be taken from workspace | |
| YLabel | Input | string | Label on the Y axis. If empty, it will be taken from workspace | |
| SpectraNames | Input | str list | Override with custom names for spectra | |
| Result | Output | string |
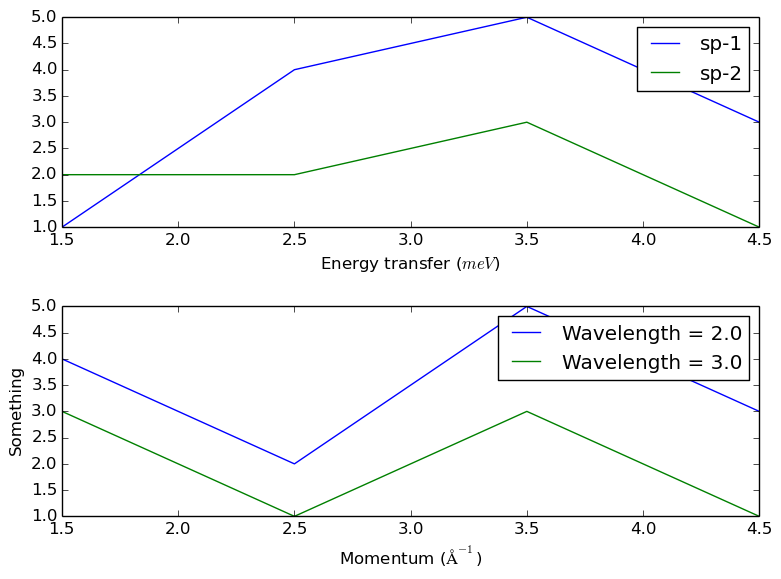
Save 1D plots to a png file, as part of autoreduction. Multiple spectra in the same workspace will be represented by curves on the same plot. Groupped workspaces will be shown as subplots. If the workspace has more than one spectra, but less or equal to ten, labels will be shown.
Note
The figures contain lines between points, no error bars.
Note
Requires matplotlib version>= 1.2.0
#create some workspaces
CreateWorkspace(OutputWorkspace='w1',DataX='1,2,3,4,5,1,2,3,4,5',DataY='1,4,5,3,2,2,3,1',DataE='1,2,2,1,1,1,1,1',NSpec='2',UnitX='DeltaE')
CreateWorkspace(OutputWorkspace='w2',DataX='1,2,3,4,5,1,2,3,4,5',DataY='4,2,5,3,3,1,3,1', DataE='1,2,2,1,1,1,1,1',NSpec='2',UnitX='Momentum',VerticalAxisUnit='Wavelength',VerticalAxisValues='2,3',YUnitLabel='Something')
wGroup=GroupWorkspaces("w1,w2")

#write to a file
try:
    import mantid
    filename=mantid.config.getString("defaultsave.directory")+"SavePlot1D.png"
    SavePlot1D(InputWorkspace=wGroup,OutputFilename=filename)
except:
    pass
Output:
The file should look like
# create some workspaces
CreateWorkspace(OutputWorkspace='w1',DataX='1,2,3,4,5,1,2,3,4,5',DataY='1,4,5,3,2,2,3,1',DataE='1,2,2,1,1,1,1,1',NSpec='2',UnitX='DeltaE')
# get the div html/javascript for the plot
div = SavePlot1D(InputWorkspace='w1', OutputType='plotly')
from postprocessing.publish_plot import publish_plot
request = publish_plot('TESTINSTRUMENT', 12345, files={'file':div})
print "post returned %d" % request.status_code
To see what the result looks like on your local system, add the Filename argument (.html extension) and change to OutputType='plotly-full'.
Categories: Algorithms | DataHandling\Plots
Python: SavePlot1D.py