The python facilities for Crystal Field calculations are avalable in Mantid from module CrystalField. There are two main classes the module provides: CrystalFiled that defines various properties of a crystal field and CrystalFieldFit that manages the fitting process.
A crystal field computation starts with cretaing an instance of the CrystalField class. The constructor has two mandatory arguments: Ion - a symbolic name of the ion, and Symmetry - a name of the symmetry group of the field. The rest of the parameters are optional.
Possible values for the Ion argument:
Ce, Pr, Nd, Pm, Sm, Eu, Gd, Tb, Dy, Ho, Er, Tm, Yb
Allowed values for Symmetry:
C1, Ci, C2, Cs, C2h, C2v, D2, D2h, C4, S4, C4h, D4, C4v, D2d, D4h, C3,
S6, D3, C3v, D3d, C6, C3h, C6h, D6, C6v, D3h, D6h, T, Td, Th, O, Oh
The minimum code to create a crystal field object is:
from CrystalField import CrystalField
cf = CrystalField('Ce', 'C2v')
Names of the crystal field parameters have the form Bnn and IBnn where nn are two digits between 0 and 6. The Bnn is a real and the IBnn is an imaginary part of a complex parameter. If a parameter isn’t set explicitely its default value is 0. To set a parameter pass it to the CrystalField constructor as a keyword argument, e.g.:
cf = CrystalField('Ce', 'C2v', B20=0.37737, B22=3.9770)
An alternative way to set a parameter is to use the param property of a CrystalField object:
cf.param['B40'] = -0.031
The param property can also be used to query the value of a parameter:
b = cf.param['B40']
CrystalFiled class has methods to calculate the Hamiltonian and its eigensystem:
# Calculate and return the Hamiltonian matrix as a 2D numpy array.
h = cf.getHamiltonian()

# Calculate and return the eigenvalues of the Hamiltonian as a 1D numpy array.
e = cf.getEigenvalues()

# Calculate and return the eigenvectors of the Hamiltonian as a 2D numpy array.
w = cf.getEigenvectors()
It is efficient to call the above methods multiple times as all the outputs are cached and the calculations are repeated only after a parameter changes.
To calculate a spectrum CrystalField needs to know the sample temperature and the shape of the peaks.
The temperature can be set either via a keyword argument Temperature of the constructor or using the Temperature property:
# Using the keyword argument
cf = CrystalField('Ce', 'C2v', B20=0.37737, B22=3.9770, Temperature=44)

# Using the property
cf.Temperature = 44
Knowing the temperature allows us to calculate a peak list: a list of transition energies and intensities.:
print cf.getPeakList()
The output is:
[[  0.00000000e+00   2.44006198e+01   4.24977124e+01   1.80970926e+01 -2.44006198e+01]
 [  2.16711565e+02   8.83098530e+01   5.04430056e+00   1.71153708e-01  1.41609425e-01]]
The first row are the energies (in meV) and the second row are the integrated intensities (in milibarn per steradian).
The number of peaks that the function returns is controlled by two tolerance parameters: ToleranceEnergy and ToleranceIntensity. If a peak has an intensity below the value of ToleranceIntensity the peak is ignored. It two peaks have a difference in the energies smaller than ToleranceEnergy they are combined into a single peak.
If we set ToleranceIntensity of the above crystal field object to 1 mb/sr we’ll have only three peaks in the list:
cf.ToleranceIntensity = 1
print cf.getPeakList()
The new output:
[[   0.           24.40061976   42.49771237]
 [ 216.71156467   88.30985303    5.04430056]]
To calcualte a spectrum we need to define a shape of each peak (peak profile function) and its default width (FWHM). The width can be set either via a keyword argument or a property with name FWHM. If the peak shape isn’t set the default of Lorentzian is assumed. To set a different shape use the setPeaks method:
cf.setPeaks('Gaussian')
cf.FWHM = 0.9
The arguments of setPeaks are expected to be names of Mantid peak fit functions. At the moment only Lorentzian and Gaussian can be used.
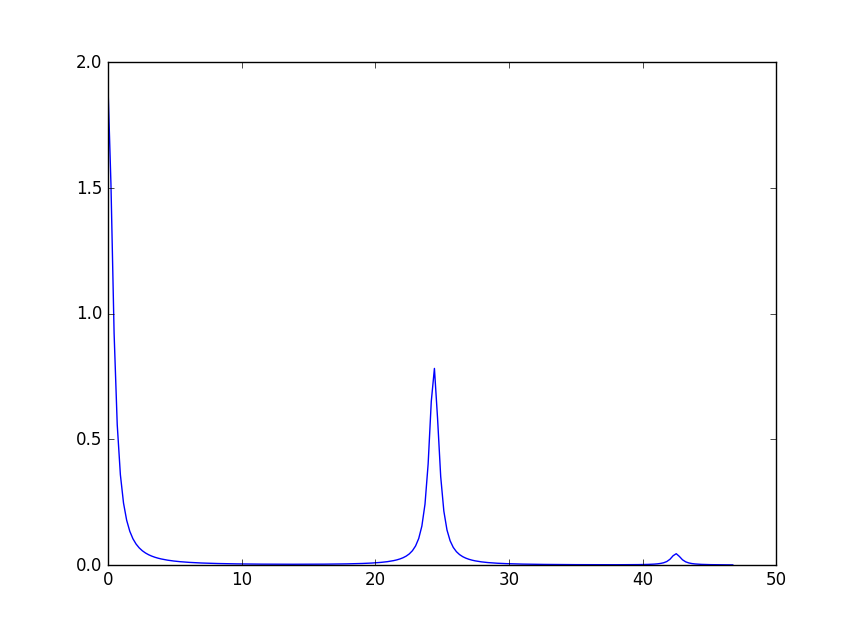
After the peak shape is defined a spectrum can be calculated:
sp = cf.getSpectrum()
The output is a tuple of two 1d numpy arrays (x, y) that can be used with matplotlib to plot:
pyplot.plot(*sp)
pyplot.show()
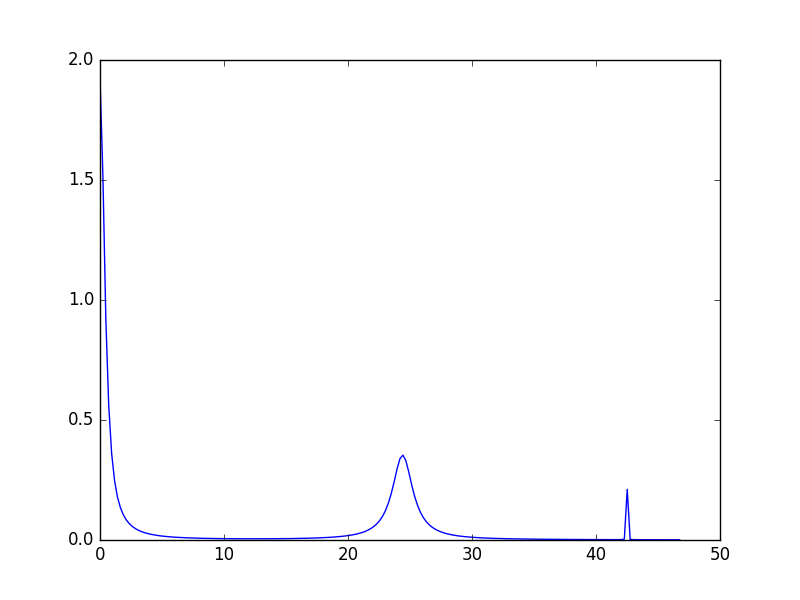
It is possible to change parameters of individual peaks separately. Note though that only the shape parameters can be changed, the peak centre and the integrated intensity are defined by the crystal field parameters. To change the width of a peak use the following syntax:
# If the peak shape is Gaussian
cf.peaks.param[1]['Sigma'] = 2.0
cf.peaks.param[2]['Sigma'] = 0.01

# If the peak shape is Lorentzian
cf.peaks.param[1]['FWHM'] = 2.0
cf.peaks.param[2]['FWHM'] = 0.01
The three peaks now have all different widths. The first peak (index 0) keeps the default value.
If called without arguments getSpectrum() determines automatically the range and number of the x-points. To have more control of how the spectrum is calculated a list (or numpy array) of x-values can be provided as a first argument to getSpectrum. Alternatively, the x-values can be taken from a workspace:
# Use a list for x-values
x = [0, 1, 2, 3, ...]
sp = cf.getSpectrum(x)

# Use the first spectrum of a workspace
sp = cf.getSpectrum(ws)

# Use the i-th spectrum of a workspace
sp = cf.getSpectrum(ws, i)
To plot a spectrum using MantidPlot’s graphing facilities CrystalField has method plot. It has the same arguments as getSpectrum and opens a window with a plot.
A background has two components: a peak and a general background function. Set a background using the background property:
from CrystalField import CrystalField, CrystalFieldFit, Background, Function
cf = CrystalField('Ce', 'C2v', B20=0.37737, B22=3.9770, B40=-0.031787, B42=-0.11611, B44=-0.12544,
                  Temperature=44.0, FWHM=1.1)
cf.background = Background(peak=Function('Gaussian', Height=10, Sigma=1),
                           background=Function('LinearBackground', A0=1.0, A1=0.01))
Here is an example of how to access the prameters of the background:
h = cf.background.peak.param['Height']
a1 = cf.background.background.param['A1']
Seting ties and constraints are done by calling the ties and constraints methods of the CrystalField class or its components. To Bnn parameters are tied by the CrystalField class directly specifying the tied parameter as a keyword argument:
cf.ties(B20=1.0, B40='B20/2')
The constraints are passed as strings containing expressions:
cf.constraints('1 < B22 <= 2', 'B22 < 4')
For the parameters of the background the syntax is the same but the methods are called on the background property:
cf.background.peak.ties(Height=10.1)
cf.background.peak.constraints('Sigma > 0')
cf.background.background.ties(A0=0.1)
cf.background.background.constraints('A1 > 0')
The names of the peak parameters both in ties and constraints must include the index of the peak to which they belong. Here we follow the naming convention of the CompositeFunction: f<n>.<name>, where <n> stands for an integer index staring at 0 and <name> is the name of the parameter. For example, f1.Sigma, f3.FWHM. Because names now contain the period symmbol ‘.’ keyword arguments cannot be used. Instead we must pass strings containing ties:
cf.peaks.ties('f2.FWHM=2*f1.FWHM', 'f3.FWHM=2*f2.FWHM')
and constraints are also a list of strings:
cf.peaks.constraints('f0.FWHM < 2.2', 'f1.FWHM >= 0.1')
If a parameter of all peaks needs to be tied/constrained with the same expression then the following shortcut methods can be used:
cf.peaks.tieAll('Sigma=0.1', 3)
cf.peaks.constrainAll('0 < Sigma < 0.1', 4)
where the first argument is the general formula of the tie/constraint and the second is the number of peaks to apply to. The is also a version for a range of peak indices:
cf.peaks.tieAll('Sigma=f0.Sigma', 1, 3)
which is equivalent to:
cf.peaks.ties('f1.Sigma=f0.Sigma', 'f2.Sigma=f0.Sigma', 'f3.Sigma=f0.Sigma')
A CrystalField object can be configured to work with multiple spectra. In this case some many of the object’s properties become lists. Here is an example of defining a CrystalField object with two spectra:
cf = CrystalField('Ce', 'C2v', B20=0.37737, B22=3.9770, B40=-0.031787, B42=-0.11611, B44=-0.12544,
                  Temperature=[44.0, 50], FWHM=[1.1, 0.9])
cf.setPeaks('Lorentzian')
cf.peaks[0].param[0]['FWHM'] = 1.11
cf.peaks[1].param[1]['FWHM'] = 1.12
cf.setBackground(peak=Function('Gaussian', Height=10, Sigma=0.3),
                 background=Function('FlatBackground', A0=1.0))
cf.background[1].peak.param['Sigma'] = 0.8
cf.background[1].background.param['A0'] = 1.1
Note how Temperature, FWHM, peaks and background become lists. They must have the same size. Ties and constraints similarily change:
# The B parameters are common for all spectra - syntax doesn't change
cf.ties(B20=1.0, B40='B20/2')
cf.constraints('1 < B22 <= 2', 'B22 < 4')

# Backgrounds and peaks are different for different spectra - must be indexed
cf.background[0].peak.ties(Height=10.1)
cf.background[0].peak.constraints('Sigma > 0.1')
cf.background[1].peak.ties(Height=20.2)
cf.background[1].peak.constraints('Sigma > 0.2')
cf.peaks[1].tieAll('FWHM=2*f1.FWHM', 2, 5)
cf.peaks[0].constrainAll('FWHM < 2.2', 1, 6)
To calcualte a spectrum call the same method getSpectrum but pass the pectrum index as its first parameter:
# Calculate second spectrum, use the generated x-values
sp = cf.getSpectrum(1)

# Calculate third spectrum, use a list for x-values
x = [0, 1, 2, 3, ...]
sp = cf.getSpectrum(2, x)

# Calculate second spectrum, use the first spectrum of a workspace
sp = cf.getSpectrum(1, ws)

# Calculate first spectrum, use the i-th spectrum of a workspace
sp = cf.getSpectrum(0, ws, i)
If there are multiple ions define CrystalField objects for each ion separately then add them together:
params = {'B20': 0.377, 'B22': 3.9, 'B40': -0.03, 'B42': -0.116, 'B44': -0.125,
          'Temperature': [44.0, 50], 'FWHM': [1.1, 0.9]}
cf1 = CrystalField('Ce', 'C2v', **params)
cf2 = CrystalField('Pr', 'C2v', **params)
cf = cf1 + cf2
To fit the crystal field and peak parameters first create a CrystalField object as described above. Then create an instance (object) of the CrystalFieldFit class:
from CrystalField import CrystalFieldFit
# In case of a single spectrum (ws is a workspace)
fit = CrystalFieldFit(Model=cf, InputWorkspace=ws)

# Or for multiple spectra
fit = CrystalFieldFit(Model=cf, InputWorkspace=[ws1, ws2])
Then call fit() method:
fit.fit()
After fitting finishes the CrystalField object updates automatically and contains new fitted parameter values.
Categories: Interfaces | Indirect