Muon Analysis Unscripted Testing
This document is intended for developers to use for unscripted testing of the Muon Analysis GUI.
User documentation for this interface can be found at Muon Analysis.
Testing here focuses on the Data Analysis tab, which has been significantly changed for Mantid 3.8.
The tests follow real use cases provided by scientists and are intended to exercise all the interface’s functionality.
- Set your facility to ISIS
- Download EMU00020918-20
- Open Interfaces/Muon/Muon Analysis
- On Settings tab, uncheck “Compatibility mode” if checked
- Set instrument to EMU, type “20918” in the “Load run” box and hit return
These test the different types of fits. The fit should succeed in each without a crash.
The results will be tested later, in the results table test section.
- Go to Data Analysis tab. Expand the window if the function browser is too small (you can drag the bar underneath it to set relative sizes of the widgets).
- The loaded dataset should be pre-selected: “20918” in Runs and “long” ticked as the group.
- “Label” box and “Co-add/Simultaneous” radio buttons should be disabled
- Click and drag blue lines on graph, check start/end times are updated.
- Check the reverse - change start/end times and blue lines should be updated on graph.
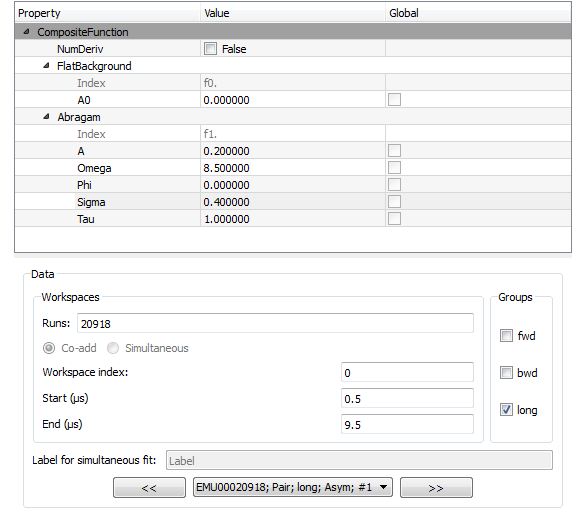
- Set up the interface to look like this. Note the non-default values for f1.Omega and f1.Sigma:
- Fit the data. Graph should be updated.
- With everything set up as in the picture above, click Fit/Sequential fit. (Runs should still be set to “20918”, a single run).
- Dialog should appear. In the runs box of the new dialog that appears, type “20918-20” and hit Start
- Sequential fit of runs 20918, 20919, 20920 should happen one after the other
- Close the sequential dialog and return to the main interface.
- Now in the “Runs” box of MuonAnalysis’s Data Analysis tab, type “20918-20” and hit return.
- Stale errors should be cleared from the function browser.
- “Co-add/Simultaneous” radio buttons should be enabled with “Co-add” selected
- “Label” box should still be disabled
- In the drop-down, there should only be one workspace (EMU00020918-20; Pair; long; Asym; #1)
- Fit as before. Graph should be updated.
- With the same runs (20918-20) selected, select the “Simultaneous” radio button option.
- Drop-down list should have three workspaces in it now, for the three runs that will be fitted.
- Keep the same fit function, but use the “Global” checkboxes to mark A, Omega, Phi and Sigma as global.
- Fit the data. Note that plot will not be updated at present.
(If you want to plot results, see the MuonSimulFit_Label workspace group)
- Use the << and >> buttons, or drop-down list, to see the fitted parameters for each run in the function browser.
- Type “20918” only in the “Runs” box
- Select both “fwd” and “bwd” as groups
- Keep fit function and global parameters as before
- Fit data. It should warn you that “Label” has already been used - say no to overwriting and it should automatically increment the label.
- Keep the same setup as Test 5, i.e. Runs=”20918”, “fwd” and “bwd” selected as groups
- Click Fit/Sequential fit to launch the dialog
- If offered the choice, choose not to overwrite the label
- Dialog should appear. In this new dialog (not the interface underneath):
- Runs = “20918-20”
- Label = “Label2”
- Hit “Start”
- This should fit the fwd and bwd groups simultaneously for each run 20918, 20919, 20920 in sequence.
After running all the fits above, go to the Results Table tab.
- Top group box: select run_number and sample_temp as logs
- Centre group box: keep the default, which should be the Individual fits radio button with both individual fits selected
- Create the table with the default name ResultsTable.
- Table should have two rows, one for runs 20918-20 (co-added) and one for run 20918.
- Sample temp should be expressed correctly as a range “180 to 200” for co-added runs
- Should be one pair of columns for each parameter + error, plus a final column for “cost function value”
- Top group box: keep same logs as before
- Select the Sequential fits radio button in the centre group box, and “Label” in the drop-down, i.e. the first sequential fit you did. Keep all three runs included.
- Create the table - check that, if you don’t change the name, it warns you about overwriting.
- The table should have three rows, one for each run, with the correct sample log values (180, 190, 200).
- Again there should be one pair of columns for each parameter and error, and a cost function column at the end.
- Now select “Label2”, the sequential fit of simultaneous fits (from test 5 above), in the drop-down next to Sequential fits (see test 2).
- The top box should have extra log values for group and period - select group (as well as run_number)
- Keep all runs selected and create table
- There should be six rows in all, two per run (one for fwd, one for bwd).
- Select the “Simultaneous fits” radio button above the centre group box.
- Keep the first “Label” selected in the drop-down list.
- Create the table
- There should be one row per run
- For the global parameters (f1.A, f1.Omega, f1.Phi, f1.Sigma), note the error is non-zero for the first run and zero for the others as they were all fitted together.
- Try the second label (“Label#2”), which was the simultaneous fit across groups. Have the group log value selected (as well as run_number). There will be one row for each group.
- Try the third label (“MUSRlabel”), the fit across periods for MUSR data. Have the period log value selected.
- Select the last radio button, “Multiple”, above the centre group box.
- Three simultaneous fit labels are listed: Label, Label#2, MUSRlabel.
- Note that they have different colours, because the number of datasets and fit models differ. You should not be able to create a table with all of these selected.
- Select just the first “Label”, log values run_number and sample_temp, and create the table.
- There should be columns for label, run number/sample temp (with correct ranges) and fit parameters.
- Non-global parameters should have a column for each dataset - so f0.f0.A0, f1.f0.A0, f2.f0.A0
- Global parameters should share a column - so just f1.A, f1.Omega etc.
The data used so far is single period, so here we will use MUSR data from the unit test data.
- Close and open the Muon Analysis interface again.
- This time, on the Home tab, set instrument to MUSR
- Load run 15189 and switch to Data Analysis tab
- An extra box should have appeared because this is multi-period data. Like this:
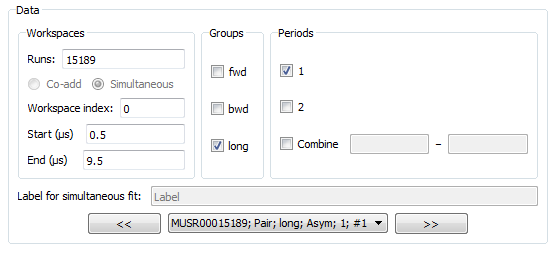
- Check the boxes for periods 1 and 2.
- Set fit function to LinearBackground and the label to “MUSRlabel”
- Fit - periods will be fitted simultaneously