Muon Analysis Unscripted Testing: Group 2 (Fitting)

Introduction

These are unscripted tests for the Muon Analysis interface. The tests here in group 2 are concerned with the different types of fits possible through the Data Analysis tab. In each test, the fit should succeed without a crash - the results will be tested later, in test group 3.

The master testing guide is located at Muon Interfaces Unscripted Testing.
Tests

Test 1: individual fit

  • On the Home tab, select instrument EMU and load EMU00020918.nxs.
  • Go to Data Analysis tab. Expand the window if the function browser is too small (you can drag the bar underneath it to set relative sizes of the widgets).
  • The loaded dataset should be pre-selected: “20918” in Runs and “All Pairs” selected in the data table.
  • “Label” box and “Co-add/Simultaneous” radio buttons should be disabled
  • Click and drag blue lines on graph, check start/end times are updated.
  • Check the reverse - change start/end times and blue lines should be updated on graph.
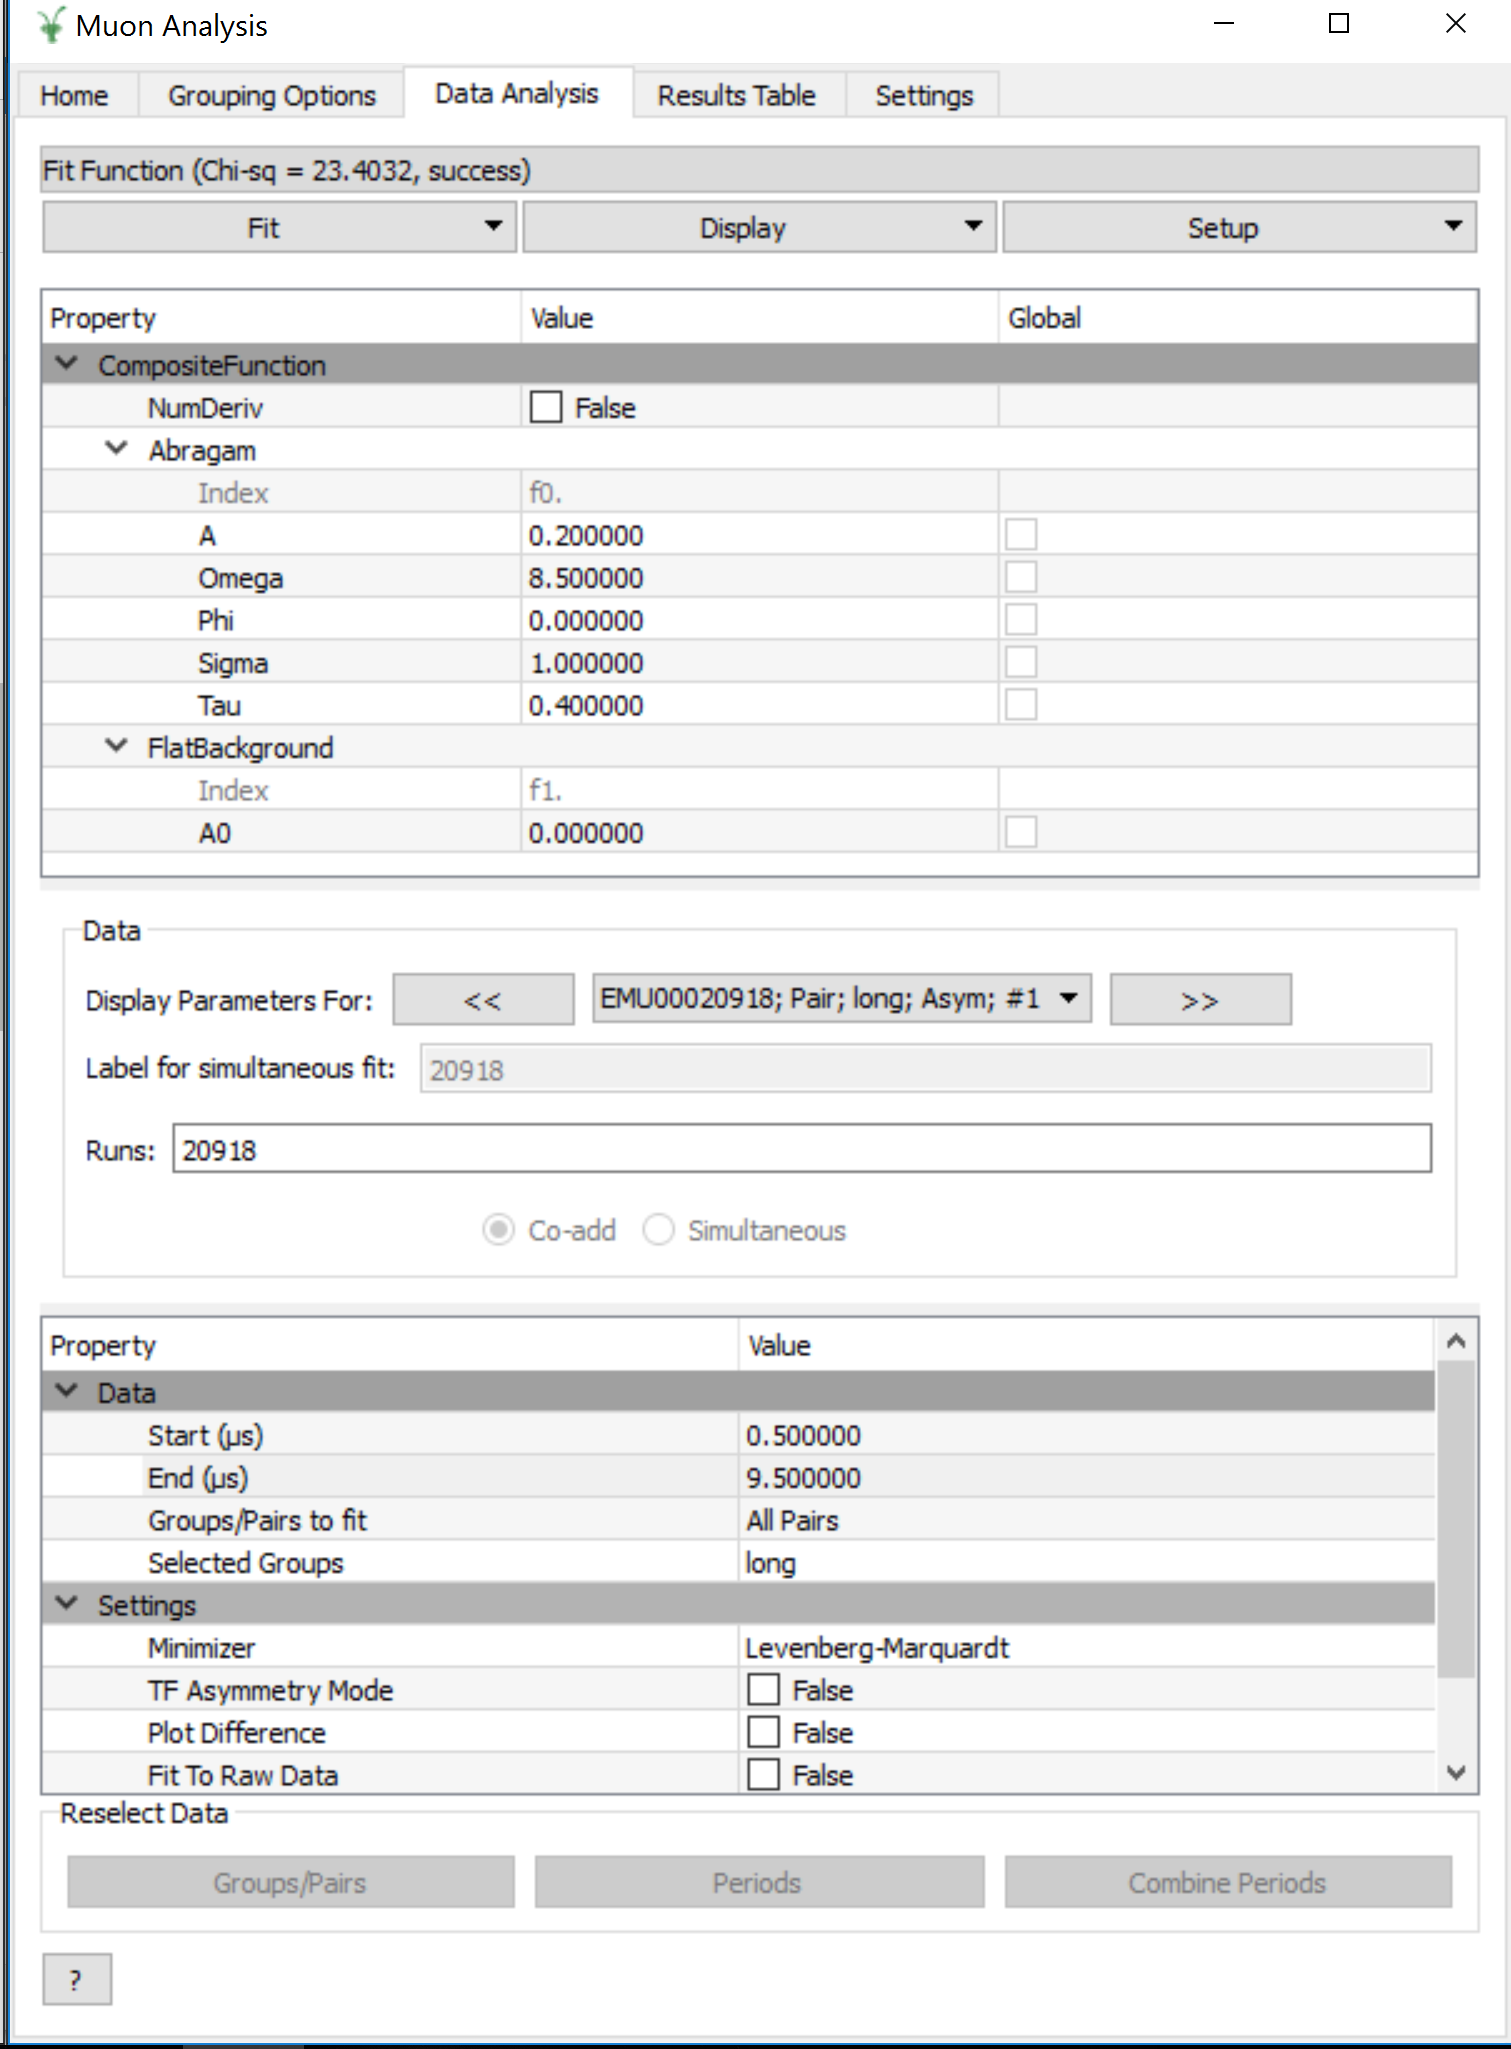
  • Set up the interface to look like this. Note the non-default values for f1.Omega and f1.Sigma:
../../_images/fitting_test1.png
  • Fit the data. Graph should be updated.

Test 2: sequential fit

  • With everything set up as in the picture above, click Fit/Sequential fit. (Runs should still be set to “20918”, a single run).
  • Dialog should appear. In the runs box of the new dialog that appears, type “20918-20” and hit Start
  • Sequential fit of runs 20918, 20919, 20920 should happen one after the other

Test 3: co-added fit

  • Stale errors should be cleared from the function browser.
  • Click the “Co-add” button.
  • The “Label” box will now be disabled
  • In the drop-down, there should only be one workspace (EMU00020918-20; Pair; long; Asym; #1)
  • Fit as before. Graph should be updated.

Test 4: simultaneous fit across runs

  • With the same runs (20918-20) selected, select the “Simultaneous” radio button option.
  • Drop-down list should have three workspaces in it now, for the three runs that will be fitted.
  • The “Label” box should be enabled. By default, this will contain the run number string (“20918-20”) - add “SimFit” to the end of the string.
  • Keep the same fit function, but use the “Global” checkboxes to mark A, Omega, Phi and Sigma as global.
  • Fit the data. Note that plot will not be updated at present. (If you want to plot results, see the MuonSimulFit_20918-20SimFit workspace group)
  • Use the << and >> buttons, or drop-down list, to see the fitted parameters for each run in the function browser.

Test 5: simultaneous fit across groups

  • Type “20918” only in the “Runs” box
  • The “Label” box should now read “20918”
  • Select both “fwd” and “bwd” as groups, deselect “long”
  • Keep fit function and global parameters as before
  • Fit data
  • Now try to fit again, without changing anything. It should warn you that the label “20918” has already been used - say no to overwriting and it should automatically increment the label to “20918#2”

Test 6: sequential fit of simultaneous fits

  • Keep the same setup as Test 5, i.e. Runs=”20918” and “All Groups” selected
  • Click Fit/Sequential fit to launch the dialog
  • If offered the choice, choose not to overwrite the label
  • Dialog should appear. In this new dialog (not the interface underneath):
    • Runs = “20918-20”
    • Label = “LabelSeq”
    • Hit “Start”
  • This should fit the fwd and bwd groups simultaneously for each run 20918, 20919, 20920 in sequence.

Test 7: simultaneous fit across periods

The data used so far is single period, so here we will use MUSR data from the unit test data.

  • Go back to the Home tab, set instrument to MUSR
  • Load run 15189 and switch to Data Analysis tab
  • (If any fit curves are still displayed, clear them with Display ‣ Clear fit curves)
  • Two extra rows (Selected Periods and Periods to fit ) should have appeared in the data table. multi-period data.
  • Note two points:
    • “All Pairs” should be selected - because “long” was loaded on the Home tab.
    • In the label box, the previous label “20918#2” has not been updated. This is because it contains a non-numeric character, so is assumed to be a user-set label (this is the intended behaviour).
  • Set label to “MUSRlabel”
  • Set fit function to LinearBackground (clear any existing function)
  • Fit - periods will be fitted simultaneously

Test 8: TF Asymmetry fit

  • Go back to the Home tab and load run 62260
  • In the Data Analysis tab “TF Asymmetry Mode” should be ticked
  • Set the “Groups/Pairs to fit” to “Custom”
  • A pop-up should appear and make sure that only “fwd” is ticked
  • Close the pop-up
  • Clear the fitting functions
  • Add a “Flat Background” and “GausOsc” functions.
  • Set “Frequency” to 1.3
  • Run a fit
  • Look at the fitting parameters and notice that the “Flat Background” is non-zero (larger than the error)
  • Remove the fitting functions
  • Add a “GausOsc” function with “Frequency” set to 1.3
  • Go to the fit menu and select TF Asymmetry Fit
  • Clear the fit functions
  • Add a “GausOsc” function and set “Frequency” to 1.3
  • Then add a “Flat Background” to the fitting functions
  • Run a normal Fit
  • The “Flat Background” should now have a value of zero (less than the error)

Test 9: Multiple TF Asymmetry fits

  • Go back to the Home tab and load run 62261
  • In the Data Analysis tab “TF Asymmetry Mode” should be ticked
  • Clear the fitting functions
  • Add a “GausOsc” function with “Frequency” set to 1.3
  • Tick the “Global” box for “Frequency” and “Sigma”
  • Go to the fit menu and select TF Asymmetry Fit
  • Then add a “Flat Background” to the fitting functions
  • Tick the “Global” box for “Frequency” and “Sigma” (this will need doing again)
  • Run a normal Fit
  • The “Flat Background” should now have a value of zero (less than the error)