Table of Contents
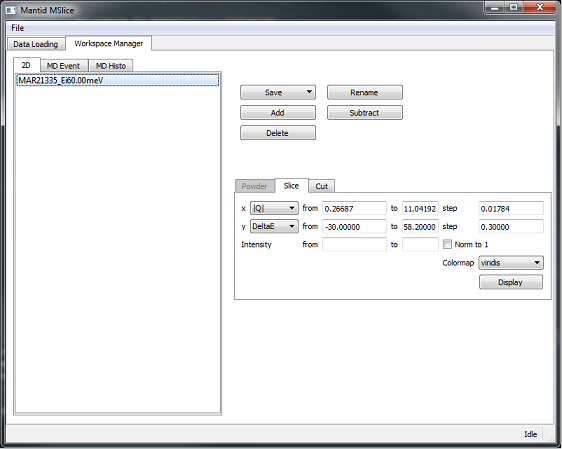
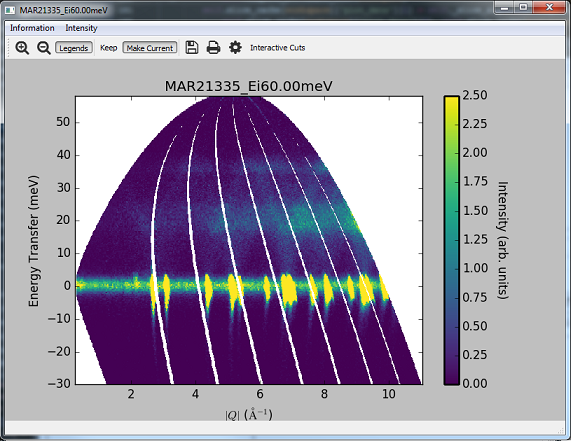
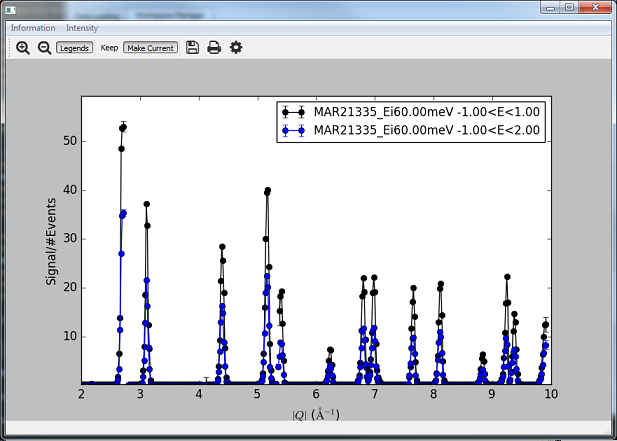
Similar to the slice viewer, MSlice plots slices and cuts from workspaces. It creates customisable publication quality figures. Cuts can be created interactively by dragging a rectangle across a slice, and information such as recoil lines and bragg peaks can be overplotted.
 (MomentumTransfer) axes.
 workspaces and cuts (line profiles) in constant
  and
and  .
. term in the CrystalFieldSusceptibility function.
Several bugs in the Python and C++ code has been fixed - see the github page for details.
(MomentumTransfer) axes.