Multi Dimensional Visualisation

Creating Your Data

The next section requires a dataset that is faster to create than Load.

  1. Click the View -> Script window menu.
  2. In the script window click File->Open, and open the file “C:MantidInstalldataCreateSXDNaClQLab.py”
  3. Click the Execute -> Execute All menu.
  4. After about 30 seconds you should have a SXDNaClQLab workspace.

Note to Demonstrators: You may want to do this during the preceding exercise.

SliceViewer

sliceviewer.png

The Slice Viewer provides 2D slices through MDWorkspaces. It is designed to provide very fast, interactive projections on large datasets. The SliceViewer is also furnished with a number of 2D tools to aid further visualisation and analysis.

Features include:

Introduction to Feature Controls

From the image above

Dimension Selection (1)

Allows you to choose which dimensions in the workspace are to be plotted X and Y on the plot. All other dimensions are provided as sliders. Each dimension has an X button and a Y button. Selecting one of these will make this dimension either the X or Y of the plot.

Slice Point Selection (2)

Sliders allow you to choose the slice location. The plot will immediately update to show a projection at the new slice location. N-2 dimensions are represented with sliders.

Line Integration Mode (3)

LineViewer.png

Selecting this button will allow you to draw a line on the current slice. This will also open the LineViewer panel. The line can be controlled in the following ways:

  • Start and end positions
  • Width in plane
  • Thickness (into plane)
  • Number of bins

The controls may be updated either graphically, for example by grabbing the start position point and moving it with the left-click mouse option, or by updating the coordinates in the LineViewer panel.

Hitting the Apply button results in the generation of a new Workspace which is one-dimensional.

Dynamic Rebinning (4)

The slice viewer allows you to interactively rebin the currently viewed slice to a regular grid. This will also result in the generation of a new rebinned workspace in Mantid. The icon labeled 4a has to be pressed first to allow rebinning. 4c automatically rebins the current view. The upper image below is before rebinning, the lower image is after rebinning.

RebinOff.png
RebinOn.png

Peaks Viewer (5)

Peaks_view_outline_unannotated.png
The PeaksViewer is a tool for Single Crystal Diffraction. It allows you to overlay one or more PeaksWorkspaces over the MDWorkspace to which it belongs. PeaksWorkspaces are typically generated by running algorithms, such as FindPeaksMD v1.
  • Slice through the MDWorkspace and the PeaksWorkspaces simultaneously in the SliceViewer plot
  • Select peaks from the peaks list in the PeaksViewer, and cause the SliceViewer to zoom into that exact location on the plot
  • Show integration regions and optionally integration background regions
  • PeaksViewer auto selects the coordinates frame for the PeaksWorkspaces based on the MDWorkspace
  • Sort the PeaksWorkspaces in-situ, for example by greatest intensity

Amongst other usages, this tool therefore allows you to inspect the quality of the peak finding, or peak integration operations.

Example

  1. Run Load on the MDWorkspace file SXDNaClQLab.nxs
  2. Run Load on the PeaksWorkspace file peaks_qLab.nxs
  3. Right click the MDWorkspace and select Show Slice Viewer option
  4. Use the Slider to slice through the Qz dimension
  5. Open the LineViewer and draw a line

Vates Simple Interface

ReleasePic.png

The Vates Simple Interface, or VSI provides full-blown 4D visualisation capabilities. The VSI uses ParaView as the visualisation engine.
Examples

Example 1

  1. Run Load on the MDWorkspace file SXDNaClQLab.nxs
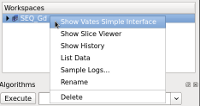
  2. Right click the MDWorkspace and select Show Vates Simple Interface. The VSI should open showing a 3D representation of the MDWorkspace MantidPlot_VSI-v2_Menu.png
  3. Click the Rebin button above the plot area
  4. On the properties panel change the number of Bins property to 100 for each dimension click the Apply button. The Workspace should now be rebinned to a regular 100*100*100 Grid
MBC_VSI_Example1.png

Example 2

  1. Complete Example 1 if you haven’t already and leave the VSI open
  2. On the top menu select the ‘’‘MultiSlice ‘’’ VSI-MultisliceButton.png mode
  3. The view should be empty. Cuts can be added by double-clicking on an axis scale between the axis scale line and the view area to place an indicator at that point and this adds the slice on the 3D view. Add a few cuts
  4. Move the cut slice positions along the axis and observe the surface projections updating
MBC_VSI_Example2.png

Example 3

  1. Follow steps 1-2 from Example 1.
  2. On the top menu select the ScatterPlot VSI-SplatterPlotButton.png mode
  3. Set the Top Percentile option on the Properties Tab to be 0.05
  4. Click ‘Use Log Scale at the top of the plot area
  5. Without closing the VSI load the file peaks_qLab.nxs into MantidPlot, which produces a PeaksWorkspace.
  6. Load the PeaksWorkspace into the VSI, by right-clicking the workspace and selecting Show Vates Simple Interface. You should now see peak positions as cross-hairs overlaid over the original MDWorkspace data.
MBC_VSI_Example3.png