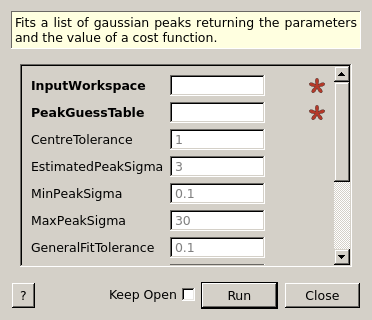
FitGaussianPeaks dialog.
Table of Contents
| Name | Direction | Type | Default | Description |
|---|---|---|---|---|
| InputWorkspace | Input | Workspace | Mandatory | Workspace with peaks to be identified |
| PeakGuessTable | Input | TableWorkspace | Mandatory | Table containing the guess for the peak position |
| CentreTolerance | Input | number | 1 | Tolerance value used in looking for peak centre |
| EstimatedPeakSigma | Input | number | 3 | Estimate of the peak half width |
| MinPeakSigma | Input | number | 0.1 | Minimum value for the standard deviation of a peak |
| MaxPeakSigma | Input | number | 30 | Maximum value for the standard deviation of a peak |
| GeneralFitTolerance | Input | number | 0.1 | Tolerance for the constraint in the general fit |
| RefitTolerance | Input | number | 0.001 | Tolerance for the constraint in the refitting |
| PeakProperties | Output | TableWorkspace | peak_table | Table containing the properties of the peaks |
| RefitPeakProperties | Output | TableWorkspace | refit_peak_table | Table containing the properties of the peaks that had to be fitted twice as the firsttime the error was unreasonably large |
| FitCost | Output | TableWorkspace | fit_cost | Table containing the value of both chi2 and poisson cost functions for the fit |
The algorithm takes:
It then performs the following steps:
 ). These peaks will not be
included in the table.
Instead they will be refitted with tighter constraints that will return sensible values for the parameters
most of the times.
These parameters will be inserted in a second table structured as the first.
). These peaks will not be
included in the table.
Instead they will be refitted with tighter constraints that will return sensible values for the parameters
most of the times.
These parameters will be inserted in a second table structured as the first. and a poisson cost function (see below).
For the Poisson fit, the background is added.
The result of the two are included in a third table.:
and a poisson cost function (see below).
For the Poisson fit, the background is added.
The result of the two are included in a third table.:The result of the fit is compared with the data using the equation:
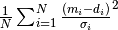
Where  is the i-th data point of the result of the fit,
  is the i-th data point
of the data to be fitted and
is the i-th data point
of the data to be fitted and  is the error on the i-th data point.
The result of the fit and input data are filtered to remove zeros in the fitted data.
They are then compared using the equation:
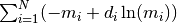
Where is the i-th data point of the result of the fit and is the i-th
data point of the data to be fitted.
This is the natural logarithm of the cost, calculated as: 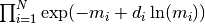
Example - Finding two simple gaussian peaks.
# Function for a gaussian peak
def gaussian(xvals, centre, height, sigma):
    exp_val = (xvals - centre) / (np.sqrt(2) * sigma)

    return height * np.exp(-exp_val * exp_val)


# Creating two peaks
x_values = np.linspace(0, 100, 1001)
centre = [25, 75]
height = [35, 20]
width = [10, 5]
y_values = gaussian(x_values, centre[0], height[0], width[0])
y_values += gaussian(x_values, centre[1], height[1], width[1])
background = 10 * np.ones(len(x_values))

# Generating a table with a guess of the position of the centre of the peaks
peak_table = CreateEmptyTableWorkspace()
peak_table.addColumn(type='float', name='Approximated Centre')
peak_table.addRow([centre[0]+2])
peak_table.addRow([centre[1]-3])

# Generating a workspace with the data and a flat background
data_ws = CreateWorkspace(DataX=np.concatenate((x_values, x_values)),
                          DataY=np.concatenate((y_values, background)),
                          DataE=np.sqrt(np.concatenate((y_values, background))),
                          NSpec=2)

# Fitting the data
parameters, refitted_parameters, cost = FitGaussianPeaks(
    InputWorkspace=data_ws,
    PeakGuessTable=peak_table,
    CentreTolerance=3.0,
    EstimatedPeakSigma=5,
    MinPeakSigma=0.0,
    MaxPeakSigma=30.0,
    GeneralFitTolerance=0.1,
    RefitTolerance=0.001
)

peak1 = parameters.row(0)
peak2 = parameters.row(1)
print('Peak 1: centre={:.2f}+/-{:.2f}, height={:.2f}+/-{:.2f}, sigma={:.2f}+/-{:.1f}'
      .format(peak1['centre'], peak1['error centre'],
              peak1['height'], peak1['error height'],
              peak1['sigma'], peak1['error sigma']))
print('Peak 2: centre={:.2f}+/-{:.2f}, height={:.2f}+/-{:.2f}, sigma={:.2f}+/-{:.1f}'
      .format(peak2['centre'], peak2['error centre'],
              peak2['height'], peak2['error height'],
              peak2['sigma'], peak2['error sigma']))
print('Chi2 cost: {:.3f}'.format(cost.column(0)[0]))
print('Poisson cost: {:.3f}'.format(cost.column(1)[0]))
Output (the number on your machine may differ slightly from these:
Peak 1: centre=25.00+/-0.11, height=35.00+/-0.47, sigma=10.00+/-0.1
Peak 2: centre=75.00+/-0.10, height=20.00+/-0.49, sigma=5.00+/-0.1
Chi2 cost: 0.000
Poisson cost: 46444.723
Categories: AlgorithmIndex | Optimization\PeakFinding
Python: FitGaussianPeaks.py (last modified: 2019-08-29)