If you’ve made it this far, then you already know how to Load Data, Execute an Algorithm on it, produce a Plot, open Slice Viewer or Instrument Viewer to Display your data and how to fit an appropriate model.
Behind the scenes, Plot and Workbench are very similar, so you can simply use your knowledge of Workbench if you decide (after discussing with your Instrument Scientist) to use Mantid Plot.
Here’s some things worth looking out for:
While this is front and centre in Workbench, in Plot you have to click the  button in the top toolbar to open it.
If want to run a script here, then click Execute > “Execute All” or press “Ctrl+Enter”.
 in the top toolbar. Now the Fit Property Browser has opened on the left of the main MantidPlot window. From now on fitting should work pretty much the same as in Workbench. The only difference it that each time you right-click on a plot to “Add a peak”, it will ask you which peak type you want.
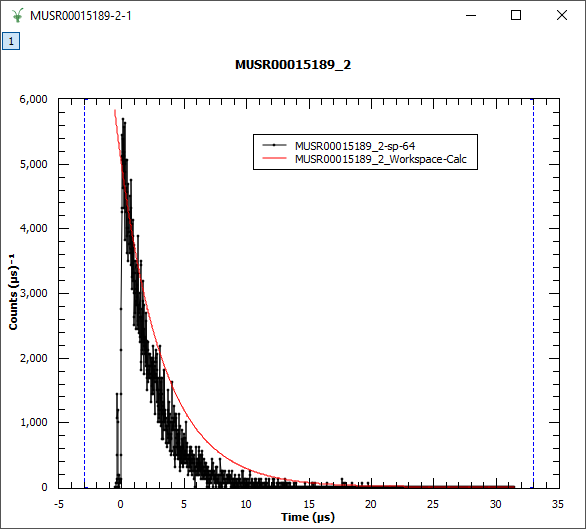
Loading, basic Plotting, and Showing Data work the same as in Workbench. But…
Using Algorithms and managing Workspaces within their Toolboxes (however rearranged) works the same way, although…