Table of Contents
The Grouping tab allows:
 values to be determined from T20 measurements.
The Grouping options are shown below
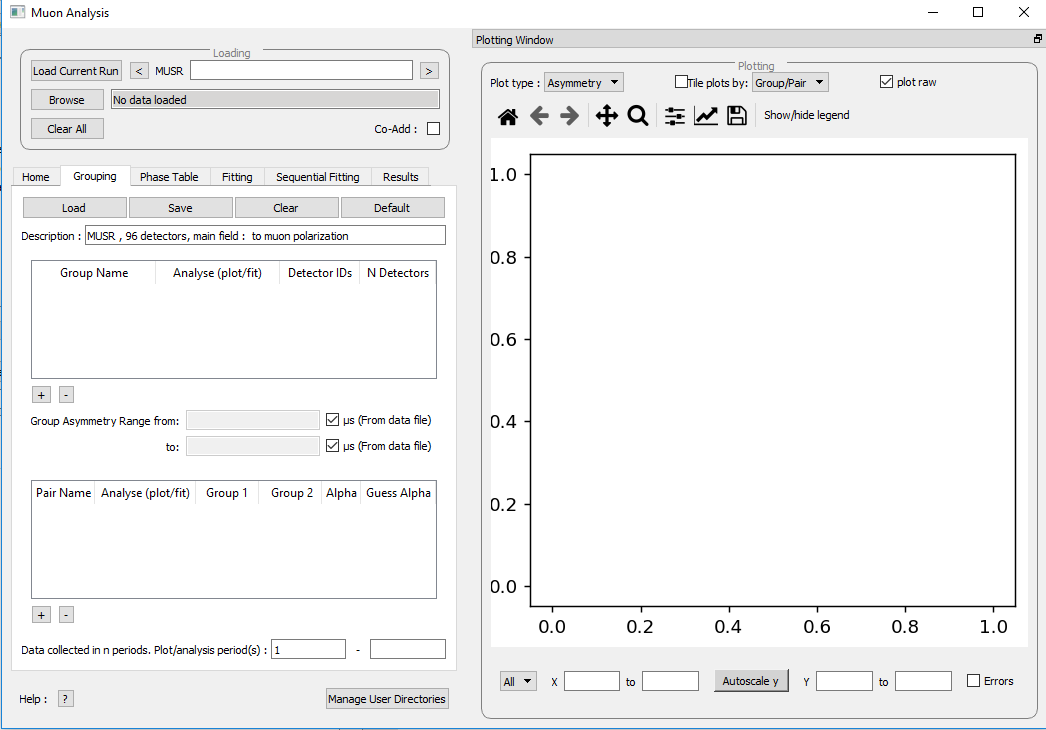
Figure 18: The Grouping Options tab of the Muon Analysis Interface.
Standard detector groupings are usually loaded when a data file is opened, which each incorporate one half of the total detectors of the equipment being used. For example, for the EMu spectrometer detectors 1 – 48 and 49 - 96 are automatically assigned to the forward and backward detector arrays.
When a workspace is opened using the Muon Analysis GUI, a plot of the data automatically opens with it. For measurements not taken in transverse fields, this
plot is set to show the asymmetry by default, which is the normalised ratio of the Forward ( ) and Backward (
 ) detector banks’ positron counts; as given by the equation:
(1)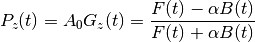
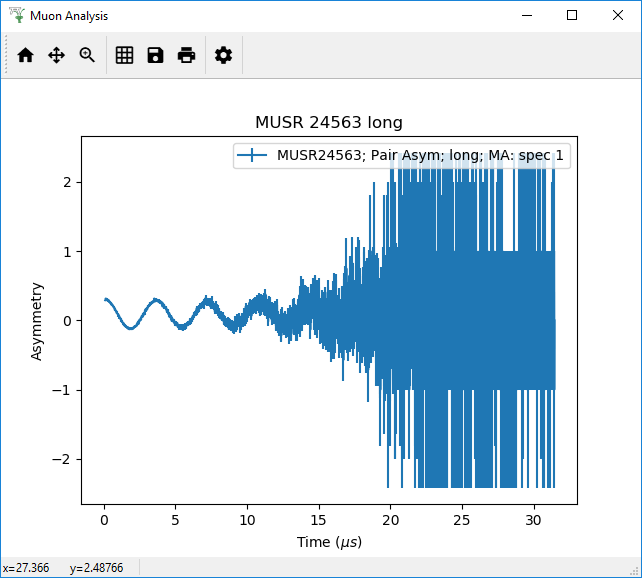
Figure 19: The default plot window for MUSR00024563 showing raw (unbinned) data for the long pair asymmetry.
Data collected only in the Forward, or Backward, detector banks can be viewed in the plotting window of the Muon Analysis GUI.
Figure 20: Plotting forward and backward counts
Though the plot type shows asymmetry by default it can be changed to show positron counts against time using the Plot Type drop-down menu, which can be found in the Plotting section of the Home tab. To demonstrate this, follow the example below.
Figure 21: How to change the plot type using the Muon Analysis GUI.
Plot options (such as symbol type, lines etc.) are described in Overlaying and Styling Plots section of Other Mantid Functions and Basic Data Manipulation.
In addition, should data have been collected using differed timing periods (as one would during an RF experiment, for example), the data collected during each separate time period can also be viewed separately (again for either the Forward and Backward detector arrays) by adjusting the period number.
When plotting data according to (1) the default alpha value is 1. An accurate alpha value can be determined using the Guess Alpha option found in the Grouping tab.
Different detector grouping configurations can be entered manually, as can Group Pairs. A Group Pair is a combination of two different detector groups. For example, the default detector groups fwd and bwd are used a pair called long. This combines the detectors from both groups in order to be able to view them together. For the MuSR equipment this default case means viewing all 64 detectors. A detector group pair can include any two groups found in the group table.
To try assigning new detector groups and pairs with the MUSR00024563 file (see Home for how to load files), follow the instructions below. For assistance, see figures 22 and 23.
Figure 22: How to add a new detector group using the Muon analysis GUI.
NB any string of numbers can be defined as `Detector IDs`, so long as they are within the number of detectors on the equipment used (i.e. `1,3-5,15,17-18` would be valid and `1,3-5,10324` would be invalid).
Figure 23: Adding a new group pair in the Muon Analysis GUI.
Once defined, these new user grouping options propagate through the Muon Analysis tabs. For example, in the Home, the options under Group/Group Pair are automatically updated to include user defined detector configurations. From there, the new groups can be plotted as they would be for the default long, bwd and fwd groups.
Finally, can be determined for any given detector pairing (via the analysis of
transverse field data) by clicking on Guess Alpha. Click on a specific Group Pair name to
select it. The value column is automatically updated. The value in the column is
applied to all subsequent data reduction when asymmetry plots are desired. The detector calibration
factor, is described in more detail in The Basics of Data Reduction.
For a summary of the controls and tables in the Grouping tab, see the Grouping Options section in Muon Analysis (old).