from mantid.simpleapi import *
# The input data set
inputData = "HRP39182"
# Load the file
Load(Filename=inputData+".RAW",OutputWorkspace=inputData,Cache="If Slow")
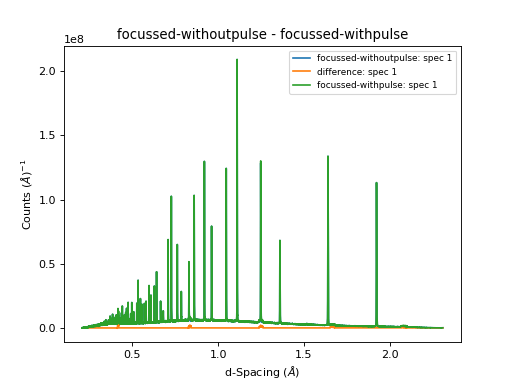
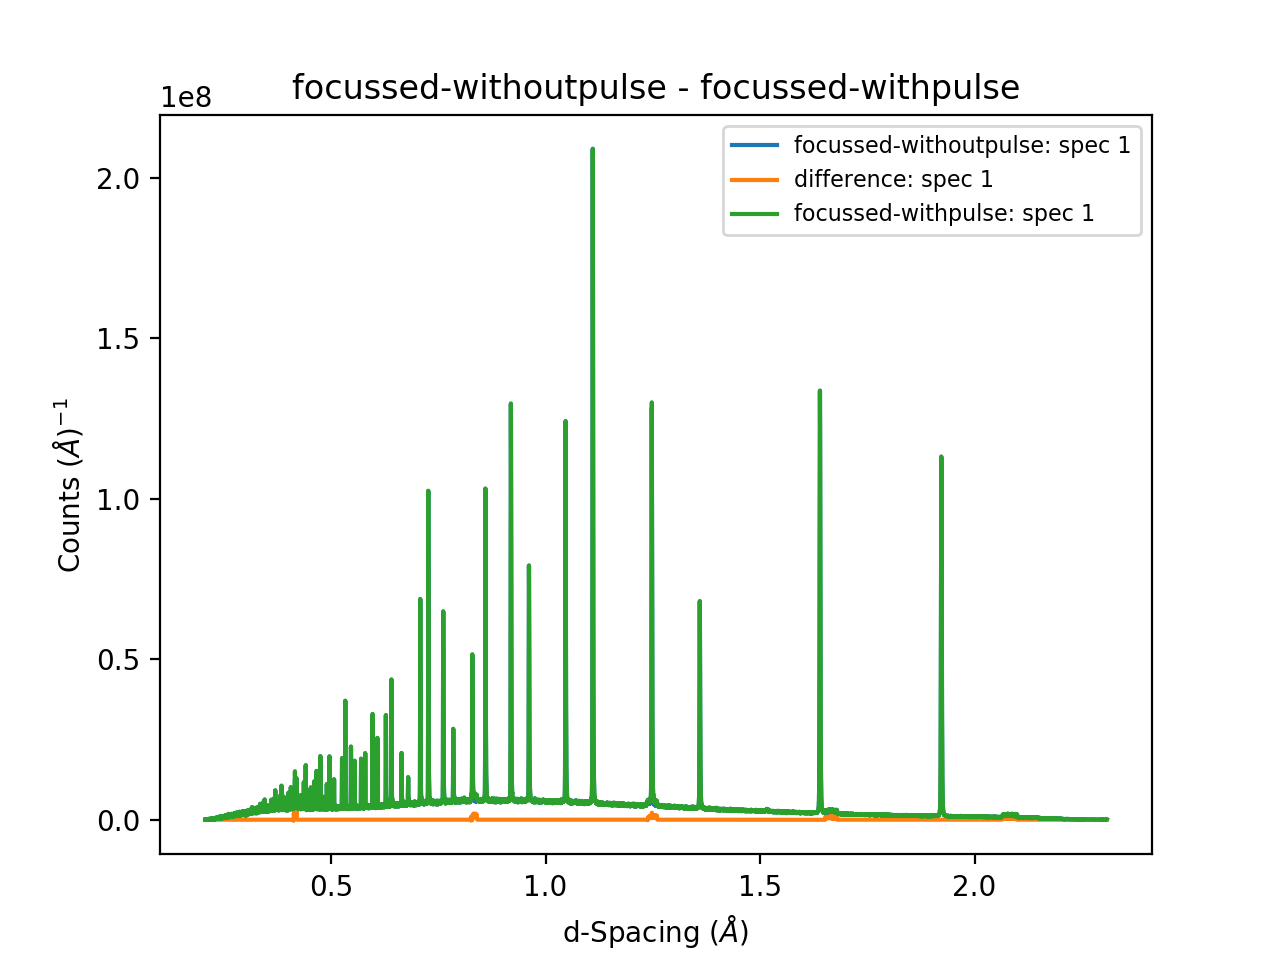
# First do the analysis without prompt pulse removal so that we can compare the difference
# Align the detectors (incoporates unit conversion to d-Spacing)
cal_file = "hrpd_new_072_01_corr.cal"
AlignDetectors(InputWorkspace=inputData,OutputWorkspace="aligned-withpulse",CalibrationFile=cal_file)
# Focus the data
DiffractionFocussing(InputWorkspace="aligned-withpulse",OutputWorkspace="focussed-withpulse",GroupingFileName=cal_file)
# Remove the prompt pulse, which occurs at at 20,000 microsecond intervals. The bin width comes from a quick look at the data
for i in range(0,5):
min = 19990 + (i*20000)
max = 20040 + (i*20000)
MaskBins(InputWorkspace=inputData,OutputWorkspace=inputData,XMin=min,XMax=max)
# Align the detectors (on the data with the pulse removed incoporates unit conversion to d-Spacing)
AlignDetectors(InputWorkspace=inputData,OutputWorkspace="aligned-withoutpulse",CalibrationFile=cal_file)
# Focus the data
DiffractionFocussing(InputWorkspace="aligned-withoutpulse",OutputWorkspace="focussed-withoutpulse",GroupingFileName=cal_file)
# Subract the processed data with and without pulse from eachother
Minus(LHSWorkspace="focussed-withpulse", RHSWorkspace="focussed-withoutpulse", OutputWorkspace="difference")
# Now plot a focussed spectrum with and without prompt peak removal so that you can see the difference
plotSpectrum(["focussed-withoutpulse","difference", "focussed-withpulse"],0)
(Source code, png, hires.png, pdf)

Right-click in the Messages toolbox and check that the log level is set to “Notice” (or lower, such as “Information” and “Debug”).
from mantid.simpleapi import *

run = Load('PG3_4871_event')
nevents = run.getNumberEvents()
logger.notice('Number of Events Before = {}'.format(str(nevents)))
filtered = FilterBadPulses(run, LowerCutoff=99.5)
aligned = AlignDetectors(InputWorkspace=filtered, CalibrationFile='PG3_golden.cal')
rebinned = Rebin(InputWorkspace=aligned, Params=[1.4,-0.0004, 8])
focused = DiffractionFocussing(InputWorkspace=rebinned, GroupingFileName='PG3_golden.cal')
compressed = CompressEvents(InputWorkspace=focused)
nevents = compressed.getNumberEvents()
logger.notice('Number of Events After = {}'.format(str(nevents)))
Output:
Number of Events Before = 22065736
Number of Events After = 555305
from mantid.simpleapi import *

# You can load each file individually, e.g.
# 164198 = Load(Filename=164198)
# ... for each file

# Or you can Load data in a loop, but you may need to import the workspaces to Python
for i in range(164198,164201):
    print( '{}.nxs'.format(i))
    Load(Filename = '{}.nxs'.format(i), OutputWorkspace = str(i))

mtd.importAll()

data_merged = MergeRuns([164198,164199,164200])
bad_spectra = [1,2,3,4,5,6,11,14,30,69,90,93,95,97,175,184,190,215,216,217,251,252,253,255,289,317,335,337]
MaskDetectors(Workspace = data_merged, SpectraList = bad_spectra)
scaled = MultiplyRange(data_merged, Factor = 0.95)
ws = ConvertUnits(scaled, Target = 'DeltaE', EFixed = 4.7728189558864003, EMode = 'Direct')
wsCorrected = DetectorEfficiencyCorUser(ws)

print("The corrected value in spectrum with ws index {}, bin {} is {:.2f} compared to {:.2f}".format(6,4,wsCorrected.readY(6)[4],ws.readY(6)[4]))
Output:
The corrected value in spectrum number 6, bin 4 is 278.85 compared to 0.95