\(\renewcommand\AA{\unicode{x212B}}\)
Mantid Workbench Changes
- New preferences can be set in
File > Settings > Plots:
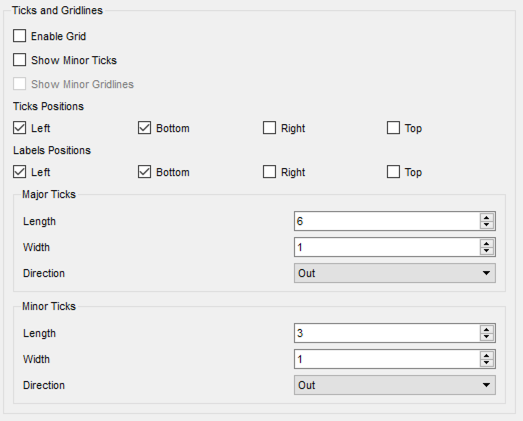
- Tick customisation
- Enabling grids by default
- Colorbar scale preference to linear or logarithmic
- Show (Hide) legend checkbox
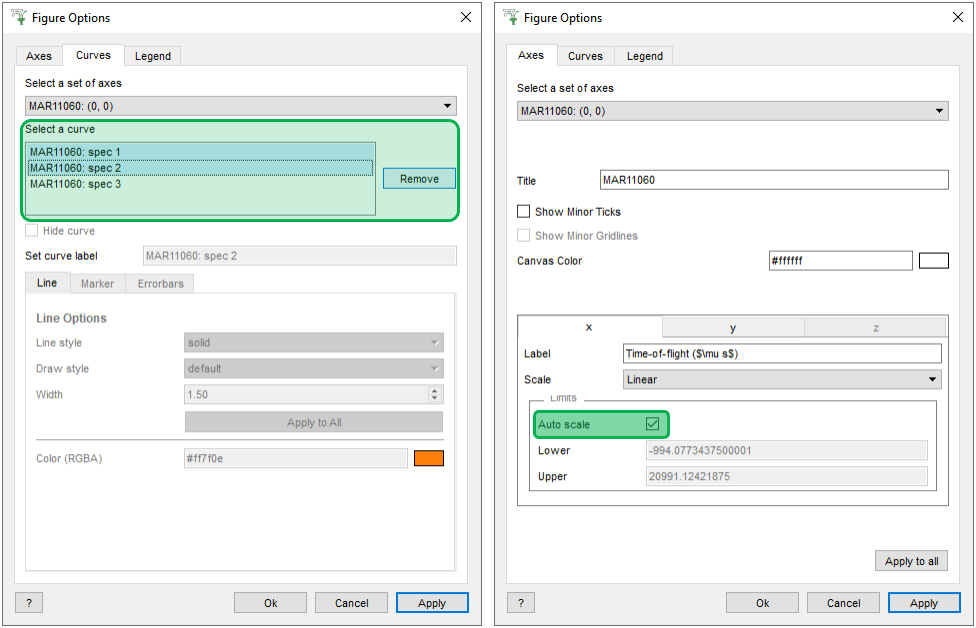
- In
Figure options > Curves tab multiple curves can be selected and removed at once. The delete key was added as a shortcut
- Add an autoscale checkbox to figure options
- Improved plot generated scripts to better support major and minor tick settings at time of generation
- Enabled the plotting of individual functions in the fit browser. Plotting of each function can be performed by right clicking on the fit function within the browser and selecting plot
- 1D Plots from MantidPlot project files can be loaded in Workbench
- Plots containing
axvline and axhline can be successfully reproduced by project save
- Vertical and horizontal markers on a plot no longer appear in front of the legend
- Allow plotting a 1D spectrum (plot, overplot, plot_with_error, overplot_with_error) from an IMDHistoWorkspace with only 1 non-integrated dimension (but do not enable SliceViewer)
- Wireframe plots no longer spill over the axes when their limits are reduced
- Colorbar limits on colorfill plots allow greater precision and scientific notation
- The zoom selection box has greater contrast with the image for SliceViewer and colorfill plots
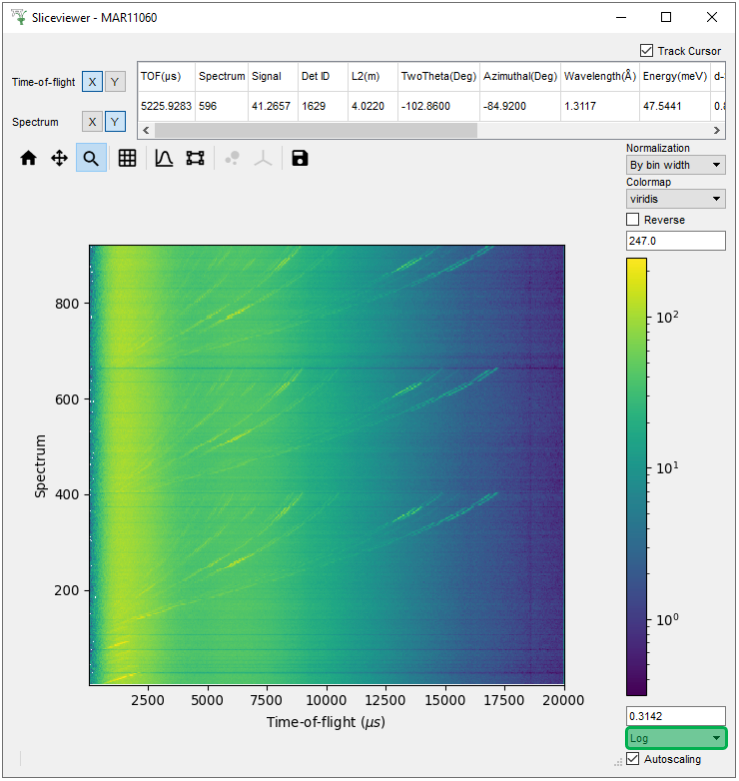
- The colorbar scale can now be set to
Log which differs from the existing Symlog option as it prohibits negative values
- Replots when the underlying workspace is modified .
- Improved spectra selection, which should ensure that high counting spectra are shown immediately when opened.
- Dynamic binning has been enabled for MDHistoWorkspaces with an attached original in the SliceViewer. Manual rebinning options are now also shown.
- SampleLogs in multiperiod event workspaces are now filtered by current period
- Added QLineEdit to SampleLogs widget to allow filtering its entries
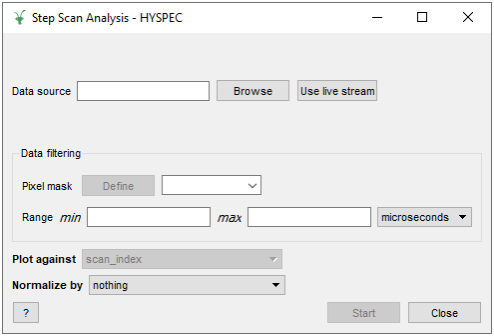
- Migrate Step Scan interface to Workbench
- Expose Instrument View control to Python
- Add the possibility to copy and paste shapes in the InstrumentViewer using
Ctrl + C and Ctrl + V
- In the InstrumentViewer, the integration scroll bar can be moved, widened and shrunk using the arrow keys
- Add a Python function to replace the workspace being shown by InstrumentViewer
- A system to group samples and avoid repetition in DrILL has been added. See the DrILL documentation for more information.
- Automatic data export in DrILL. See the DrILL documentation for more information.
- Added a Dx data tab on the
Show Data table when a workspace has Dx data
- Improved the clarity of error messages generated by algorithms when access to a file is denied due to insufficient user permissions
- Remove Load and Fit algorithm dialogs from autocompletion
- Displayed data updates correctly when changing axis selection
- The axis limits for non-orthogonal data are now calculated to display all data for that zoom level
- Axes limits of sliceviewer are now updated correctly when orthogonal axes were transposed.
- Now monitor spectra and spectra with nan or inf values are ignored in determining axes limits
- Opening SliceViewer for a workspace with a text axis is now handled correctly.
- Cursor data now work for Direct or Indirect data
- It is now not possible to zoom in too far on MDE workspaces
- Only enable SliceViewer for MDEventWorkspaces with 2 or more dimensions
- Ellipsoid axes of integrated peaks are correctly transformed when axes swapped
- A number of issues with displaying ellipsoid peak shapes have been fixed
- For the elliptical shell of integrated peaks, the inner background radius is now correct
- The background shell of spherical peaks is now plotted if inner radius equals the peak radius
- The sort order of peaks in the peaks overlay has been corrected
- Now the correct view is displayed for orthogonal axis indices in non-orthogonal view
- Displayed peaks update if the underlying PeaksWorkspace has been changed, removed or cleared
- For ragged workspaces, the data table can be shown, they can be plotted, and colorfill plots have the correct horizontal extent
- Script generation for bin plots now matches the output bin plot from a data table
- Show spectrum numbers instead of workspace index in plotBin
- A bin plot for a workspace with a numerical spectrum axis, the x axis values are from the numerical axis rather than the spectrum numbers
- A colorfill plot rescales after the underlying workspace is replaced
- Editing legends in-situ is now also possible on Linux platforms
- Removing the last curve on a plot is now handled smoothly
- In figure options the axes title is synced between the axis and curves tabs
- Error handling for using broken e notation for plot axis limits
- The error every value in figure options now matches the plotted error bars
- Deleting rows or columns in a TableWorkspace is handled smoothly
- The fit button in the fit browser is now disabled when all functions are removed
- Pressing
Esc to close ManageUserDirectories is now handled correctly
- Fixed a crash when selecting Show Detectors on a workspace with a spectrum which is missing an EFixed and is not a monitor.
Release 6.0.0