\(\renewcommand\AA{\unicode{x212B}}\)
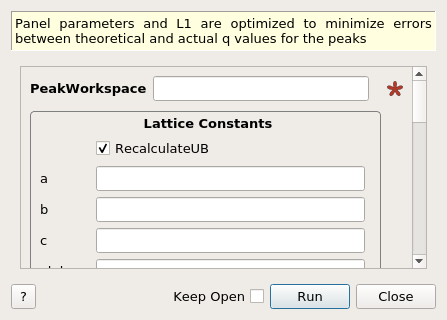
SCDCalibratePanels dialog.
Table of Contents
Panel parameters and L1 are optimized to minimize errors between theoretical and actual q values for the peaks
| Name | Direction | Type | Default | Description |
|---|---|---|---|---|
| PeakWorkspace | Input | IPeaksWorkspace | Mandatory | Workspace of Indexed Peaks |
| RecalculateUB | Input | boolean | True | Recalculate UB matrix using given lattice constants |
| a | Input | number | Optional | Lattice Parameter a (Leave empty to use lattice constants in peaks workspace) |
| b | Input | number | Optional | Lattice Parameter b (Leave empty to use lattice constants in peaks workspace) |
| c | Input | number | Optional | Lattice Parameter c (Leave empty to use lattice constants in peaks workspace) |
| alpha | Input | number | Optional | Lattice Parameter alpha in degrees (Leave empty to use lattice constants in peaks workspace) |
| beta | Input | number | Optional | Lattice Parameter beta in degrees (Leave empty to use lattice constants in peaks workspace) |
| gamma | Input | number | Optional | Lattice Parameter gamma in degrees (Leave empty to use lattice constants in peaks workspace) |
| CalibrateT0 | Input | boolean | False | Calibrate the T0 (initial TOF) |
| CalibrateL1 | Input | boolean | True | Change the L1(source to sample) distance |
| CalibrateBanks | Input | boolean | True | Calibrate position and orientation of each bank. |
| OutputWorkspace | Output | TableWorkspace | Mandatory | The workspace containing the calibration table. |
| DetCalFilename | Input | string | SCDCalibrate2.DetCal | Path to an ISAW-style .detcal file to save. Allowed extensions: [‘.detcal’, ‘.det_cal’] |
| XmlFilename | Input | string | SCDCalibrate2.xml | Path to an Mantid .xml description(for LoadParameterFile) file to save. Allowed extensions: [‘.xml’] |
| CSVFilename | Input | string | SCDCalibrate2.csv | Path to an .csv file which contains the Calibration Table. Allowed extensions: [‘.csv’] |
| ToleranceOfTranslation | Input | number | 0.0005 | Translations in meters found below this value will be set to 0 |
| ToleranceOfReorientation | Input | number | 0.05 | Reorientation (rotation) angles in degree found below this value will be set to 0 |
| TranslationSearchRadius | Input | number | 0.05 | This is the search radius when calibrating component translations using optimization. For CORELLI instrument, most panels will shift within 5cm, therefore the search radius is set to 5e-2. |
| RotationSearchRadius | Input | number | 5 | This is the search radius when calibrating component orientations using optimization. For CORELLI instrument, most panels will wobble within 5 degrees, therefore the default values is set to 5 here. |
| SourceShiftSearchRadius | Input | number | 0.1 | This is the search radius when calibrating source shift, L1, using optimization. For CORELLI instrument, the source shift is often within 10 cm, therefore the default value is set to 0.1. |
| VerboseOutput | Input | boolean | False | Toggle of child algorithm console output. |
This calibration algorithm is developed for CORELLI type instrument (pack of tubes). The calibration targets includes L_1 (source to sample distance in meters), panel position (in meters) and orientation (as angle-axis pairs, in degrees), as well as initial TOF offset (not fully implemented yet). The underlining mechanism of this calibration is to match the measured Q vectors (Q_{sample}) with the those generated from tweaked instrument position and orientation, i.e.
where NINT is the nearest integer function. To improve the speed of calibration of the whole instrument, openMP was used for calibration of banks (panels), which can unfortunately leads to out-of-order console logs. By default, the initial TOF (time of flight) is optimized if the corresponding option is set to true, followed by the calibration of L1 as well as all Panels if requested. If the users are not familiar with the instrument, the options in the advanced control group should be left untouched as tweaking these paramters can drastically affect the constrained optimization used under-the-hood.
# necessary import
import numpy as np
from collections import namedtuple
from mantid.simpleapi import *
from mantid.geometry import CrystalStructure

# generate synthetic testing data
def convert(dictionary):
    return namedtuple('GenericDict', dictionary.keys())(**dictionary)

# lattice constant for Si
# data from Mantid web documentation
lc_silicon = {
    "a": 5.431,  # A
    "b": 5.431,  # A
    "c": 5.431,  # A
    "alpha": 90,  # deg
    "beta": 90,  # deg
    "gamma": 90,  # deg
}
silicon = convert(lc_silicon)
cs_silicon = CrystalStructure(
    f"{silicon.a} {silicon.b} {silicon.c}",
    "F d -3 m",
    "Si 0 0 0 1.0 0.05",
)

# Generate simulated workspace for CORELLI
CreateSimulationWorkspace(
    Instrument='CORELLI',
    BinParams='1,100,10000',
    UnitX='TOF',
    OutputWorkspace='cws',
)
cws = mtd['cws']

# Set the UB matrix for the sample
# u, v is the critical part, we can start with the
# ideal position
SetUB(
    Workspace="cws",
    u='1,0,0',  # vector along k_i, when goniometer is at 0
    v='0,1,0',  # in-plane vector normal to k_i, when goniometer is at 0
    **lc_silicon,
)

# set the crystal structure for virtual workspace
cws.sample().setCrystalStructure(cs_silicon)

# tweak L1
dL1 = 1.414e-2  # 1.414cm
MoveInstrumentComponent(
    Workspace='cws',
    ComponentName='moderator',
    'X'=0, 'Y'=0, 'Z'=dL1,
    RelativePosition=true,
)

# Generate predicted peak workspace
dspacings = convert({'min': 1.0, 'max': 10.0})
wavelengths = convert({'min': 0.8, 'max': 2.9})

# Collect peaks over a range of omegas
CreatePeaksWorkspace(OutputWorkspace='pws')
omegas = range(0, 180, 3)

for omega in tqdm(omegas):
    SetGoniometer(
        Workspace="cws",
        Axis0=f"{omega},0,1,0,1",
    )

    PredictPeaks(
        InputWorkspace='cws',
        WavelengthMin=wavelengths.min,
        wavelengthMax=wavelengths.max,
        MinDSpacing=dspacings.min,
        MaxDSpacing=dspacings.max,
        ReflectionCondition='All-face centred',
        OutputWorkspace='_pws',
    )

    CombinePeaksWorkspaces(
        LHSWorkspace="_pws",
        RHSWorkspace="pws",
        OutputWorkspace="pws",
    )

pws = mtd['pws']

# move the source back to make PWS forget the answer
MoveInstrumentComponent(
    Workspace='pws',
    ComponentName='moderator',
    'X'=0, 'Y'=0, 'Z'=-dL1,
    RelativePosition=true,
)

# run the calibration on pws
# similar to actual calibration, where
#   1. the peaks in side pws knows the correct L1, but info is embeded in Qsamples
#   2. the recored L1 in instrument Info is the default engineering value
SCDCalibratePanels(
    PeakWorkspace="pws",
    a=silicon.a,
    b=silicon.b,
    c=silicon.c,
    alpha=silicon.alpha,
    beta=silicon.beta,
    gamma=silicon.gamma,
    CalibrateT0=False,
    CalibrateL1=True,
    CalibrateBanks=False,
    OutputWorkspace="testCaliTable",
    XmlFilename="test.xml",
)
This calibration should be able to correct the L1 recorded in the instrument info using the information embeded in all peaks.
This algorithm is a work-in-progress as the development team as well as the instrument scientists are working on the following targets:
Categories: AlgorithmIndex | Crystal\Corrections
C++ header: SCDCalibratePanels2.h (last modified: 2021-03-31)
C++ source: SCDCalibratePanels2.cpp (last modified: 2021-04-01)