\(\renewcommand\AA{\unicode{x212B}}\)
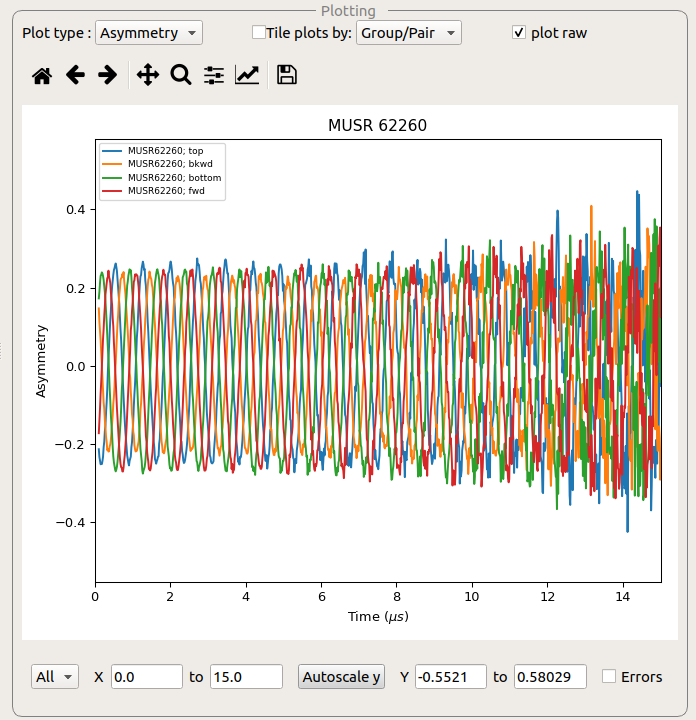
The plotting window displays the data specified by the tabs within the interface. This data can be displayed as a single plot, or as tiled plots, where each tile corresponds to either a Group/pair or a run. By default this plot window is docked to the right-hand side of the main interface window, but can be undocked by double-clicking on the title bar of the window.
The workspaces plotted in the figure depends on the tab which is currently being viewed:
The plotting can be controlled through serveral options:
Plot type Changes the plot type (e.g from asymmetry to counts).
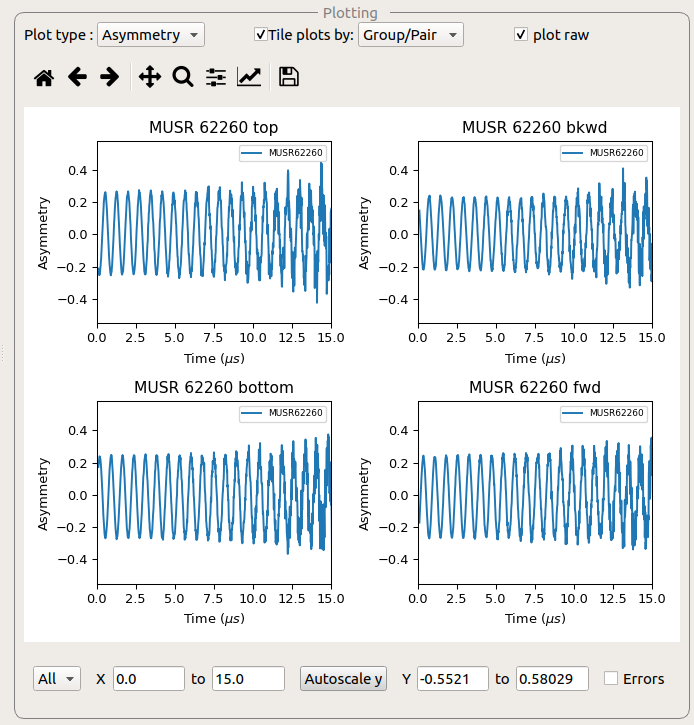
Tiled plotting The ‘tile plots by’ checkbox enables tiled plotting, which can be performed over runs or Groups/pairs.
Plot raw Plot raw controls whether the raw or rebinned workspaces are plotted.

Subplot Selector Which axis to change the options for.
x-Range Sets the x-limits for the selected axes.
Autoscale Autoscales the y-axis based on the x-limits.
y-Range Sets the y-limits for the selected axes.
Errors Whether to display errors for the workspaces plotted on the selected axes.