\(\renewcommand\AA{\unicode{x212B}}\)
Other Plot Types
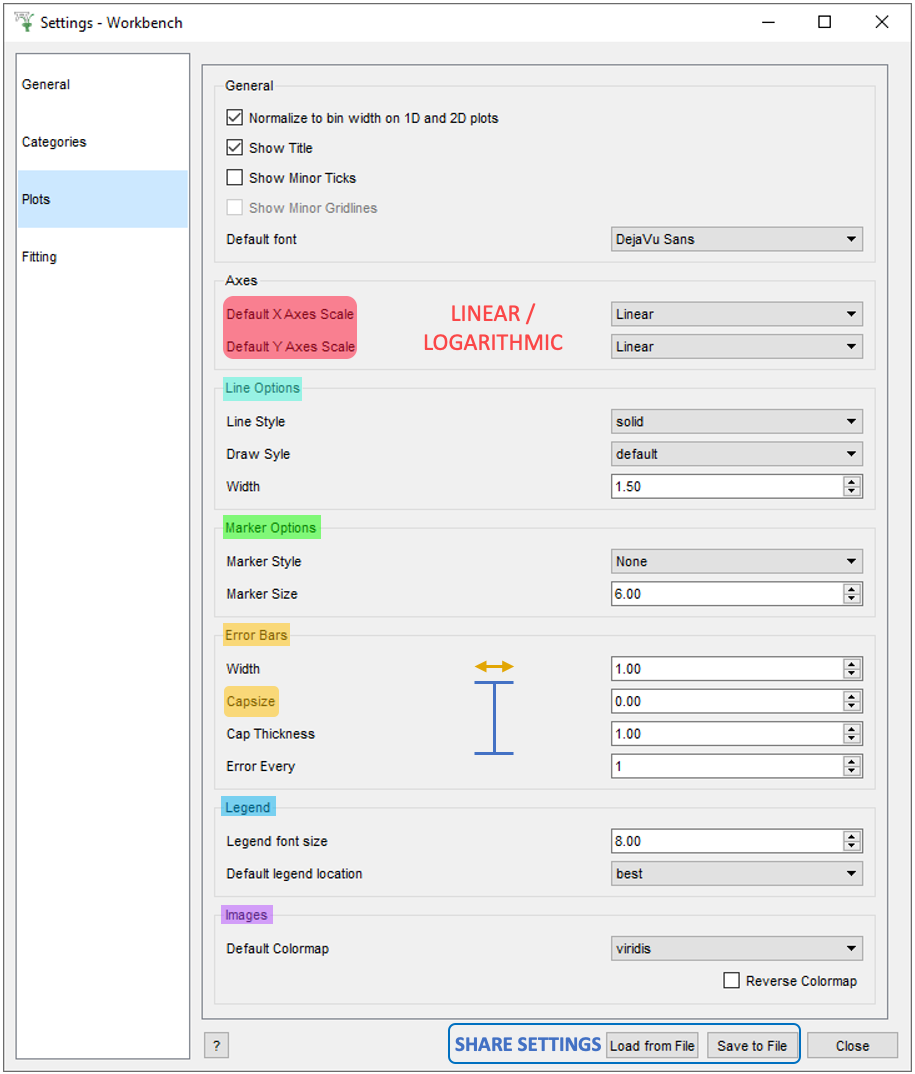
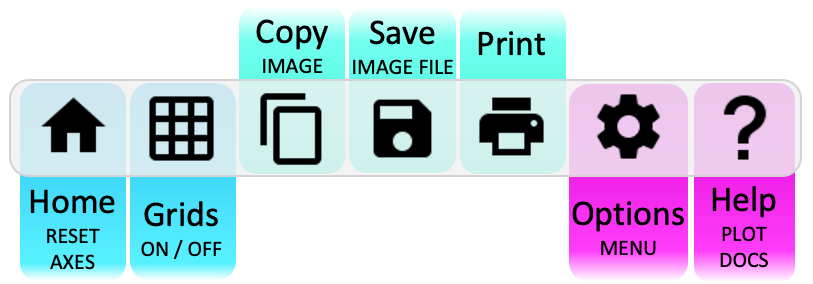
General Plot Help
3D Mesh Plots - Table of contents
Mesh Plots can only be accessed with a script, not through the Workbench interface
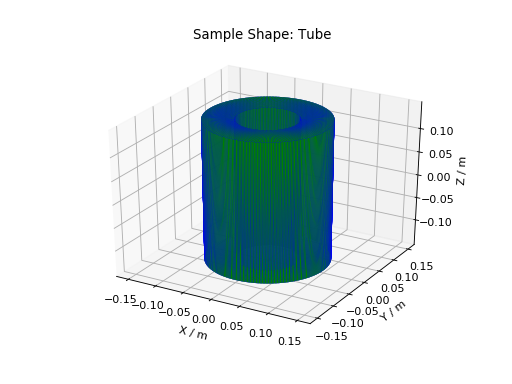
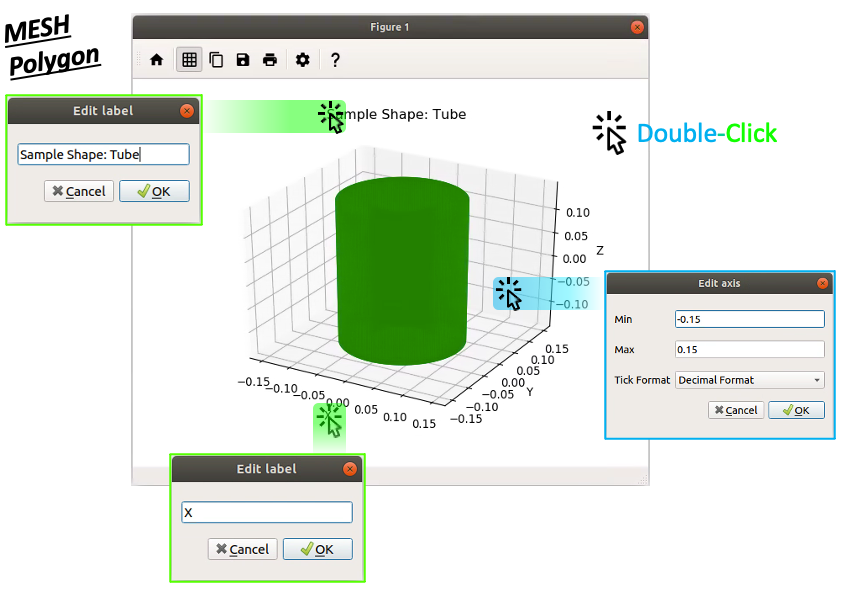
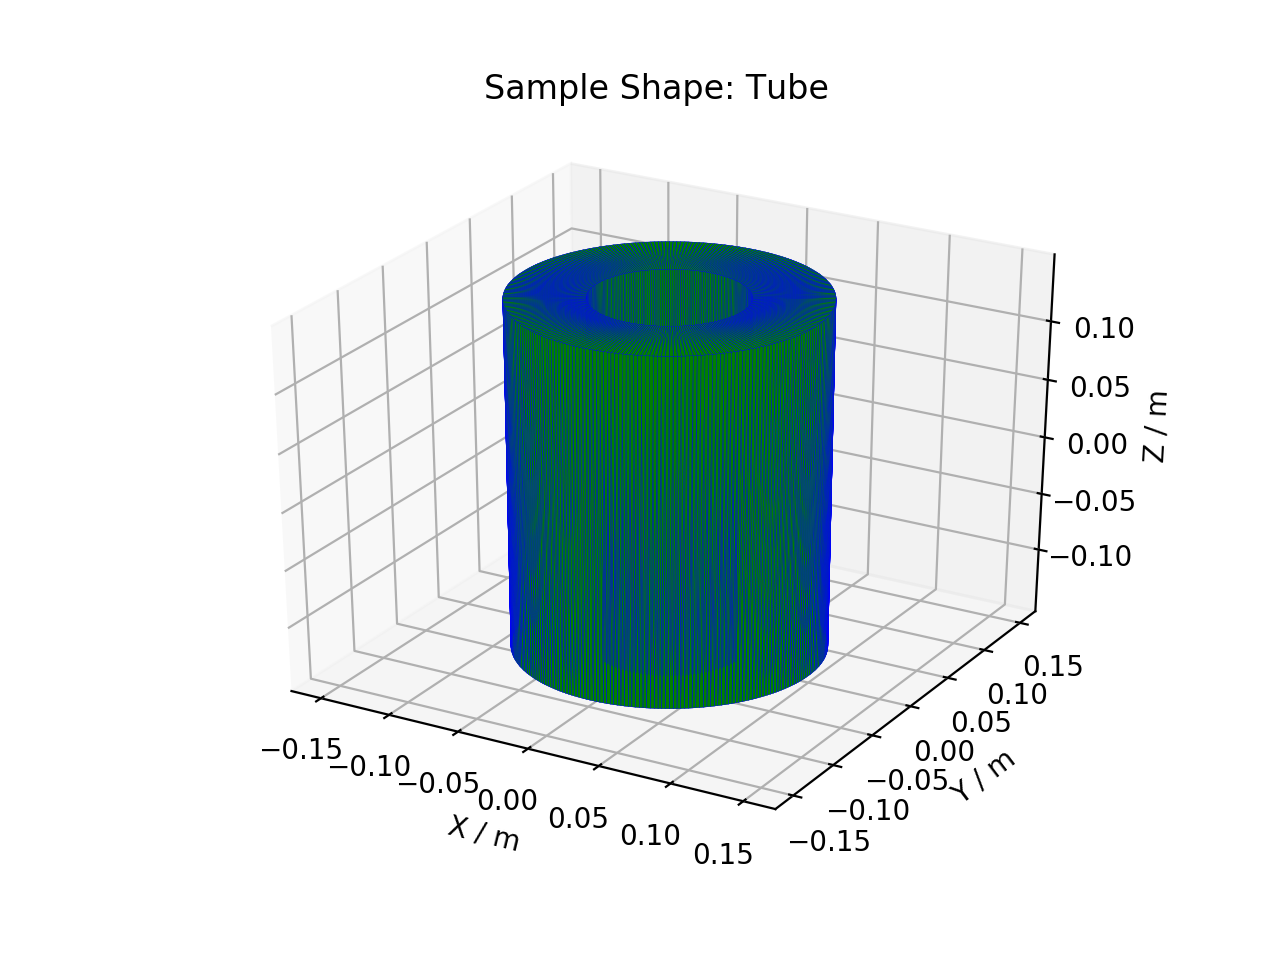
Basic example of plotting a general Poly3DCollection Polygon:
from mantid.simpleapi import *
import matplotlib.pyplot as plt
import numpy as np

from mpl_toolkits.mplot3d.art3d import Poly3DCollection
from mantid.api import AnalysisDataService as ADS

# load sample shape mesh file for a workspace
ws = CreateSampleWorkspace()
# alternatively: ws = Load('filepath') or ws = ADS.retrieve('ws')
ws = LoadSampleShape(ws, "tube.stl")

# get shape and mesh vertices
sample = ws.sample()
shape = sample.getShape()
mesh = shape.getMesh()

# Create 3D Polygon and set facecolor
mesh_polygon = Poly3DCollection(mesh, facecolors = ['g'], edgecolors = ['b'], alpha = 0.5, linewidths=0.1)

fig, axes = plt.subplots(subplot_kw={'projection':'mantid3d'})
axes.add_collection3d(mesh_polygon)

# Auto scale to the mesh size
axes_lims = mesh.flatten()
axes.auto_scale_xyz(axes_lims, axes_lims, axes_lims)

axes.set_title('Sample Shape: Tube')
axes.set_xlabel('X / m')
axes.set_ylabel('Y / m')
axes.set_zlabel('Z / m')

plt.show()
(Source code, png, hires.png, pdf)
For more advice: Formatting Plots with a script
General Plot Help
Other Plotting Documentation
