\(\renewcommand\AA{\unicode{x212B}}\)
In this exercise we will fit a simple Gaussian on a linear background.
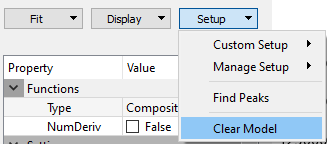
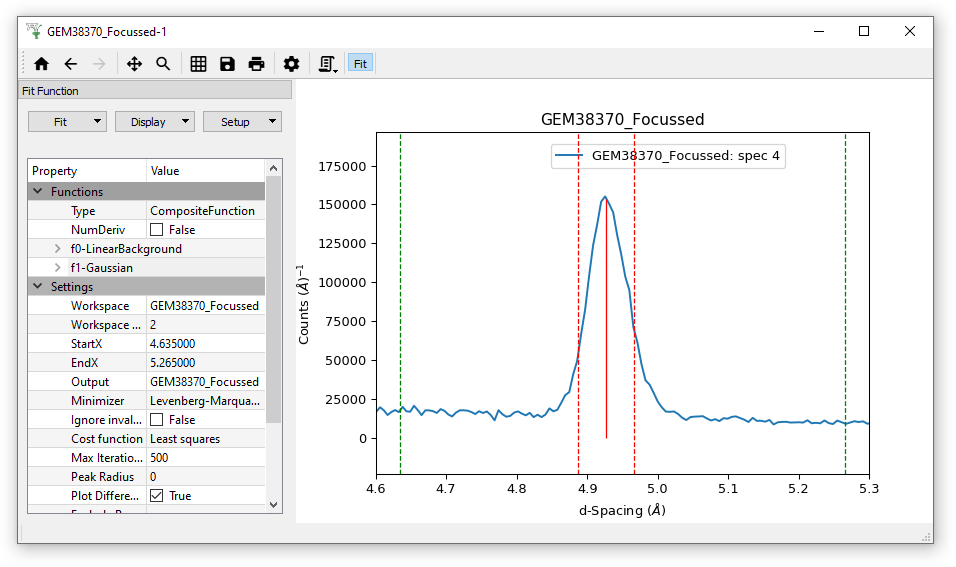
Again, ensure that the Fit model is clear by clicking Setup >”Clear model”
Load the GEM63437_focussed.nxs data (different to the data in Exercise 1). Note the workspace created is a WorkspaceGroup, which has already been processed with Mantid. Click on the triangle to reveal the contained workspaces. Show the History to see how many algorithms have been applied to this dataset.
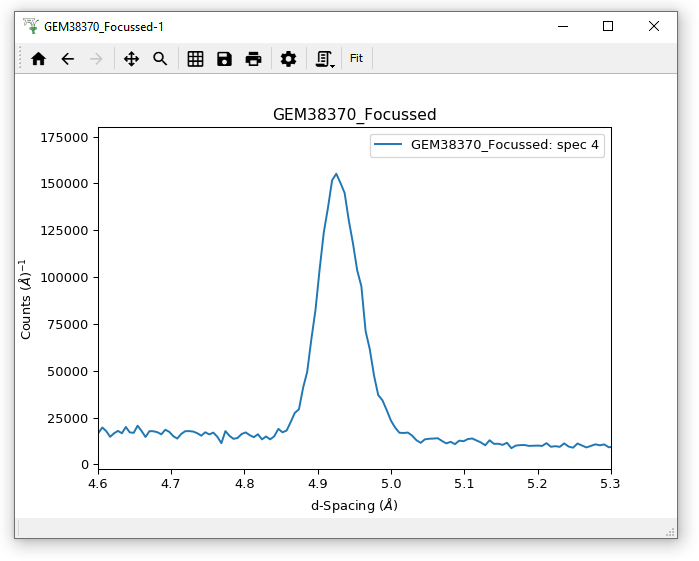
Plot the spectrum in GEM63437_focussed_2 by double-clicking on this workspace, and zoom in on the area of the three peaks
Open the Fit Property Browser and set fitting range/StartX and EndX to be between approximately 2270 and 5000 microseconds
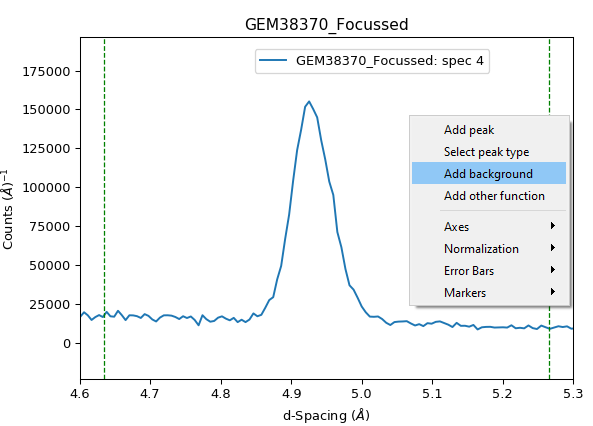
Right click on plot and select “Add background”, then LinearBackground
Change the peak type to IkedaCarpenterPV.
Remember, this is a peak function where some parameters are set based on the relevant instrument geometry. This is evident from the starting guess of the peak width but also by inspecting this function in the Fit Function panel.
Add an IkedaCarpenterPV peak to each of the three peaks, remembering to change the peak width (at least for the first one!)
Display > “Plot guess” and what you should see is something similar to
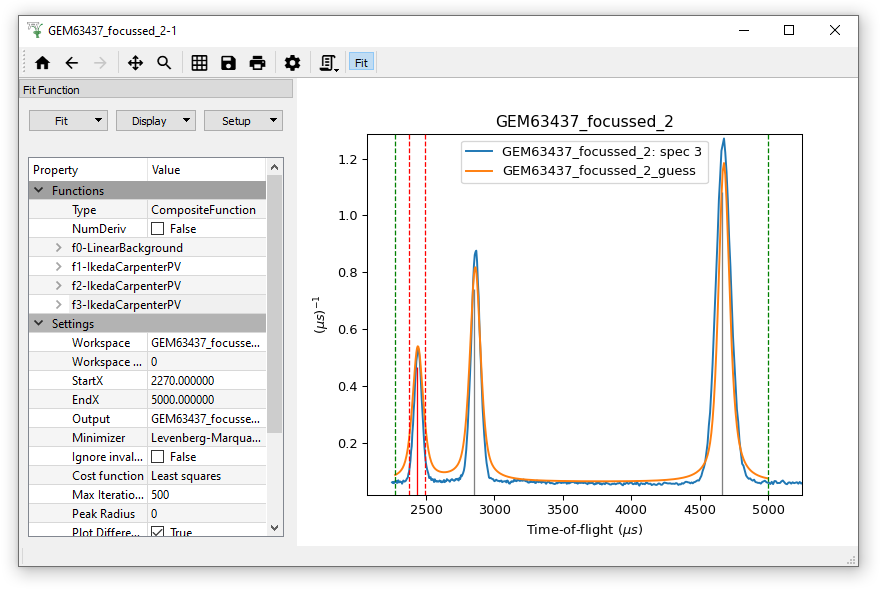
where the orange line is the guess
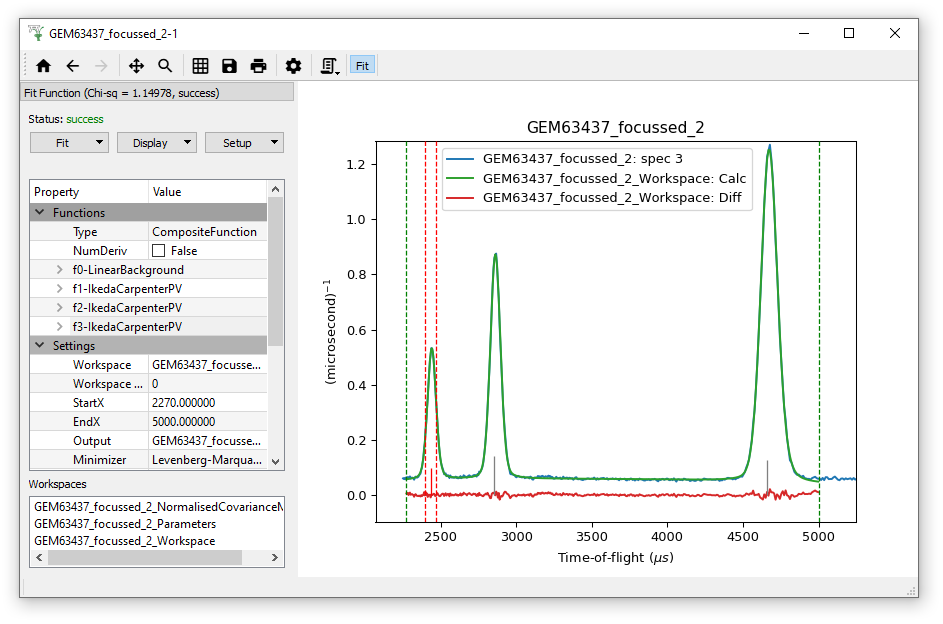
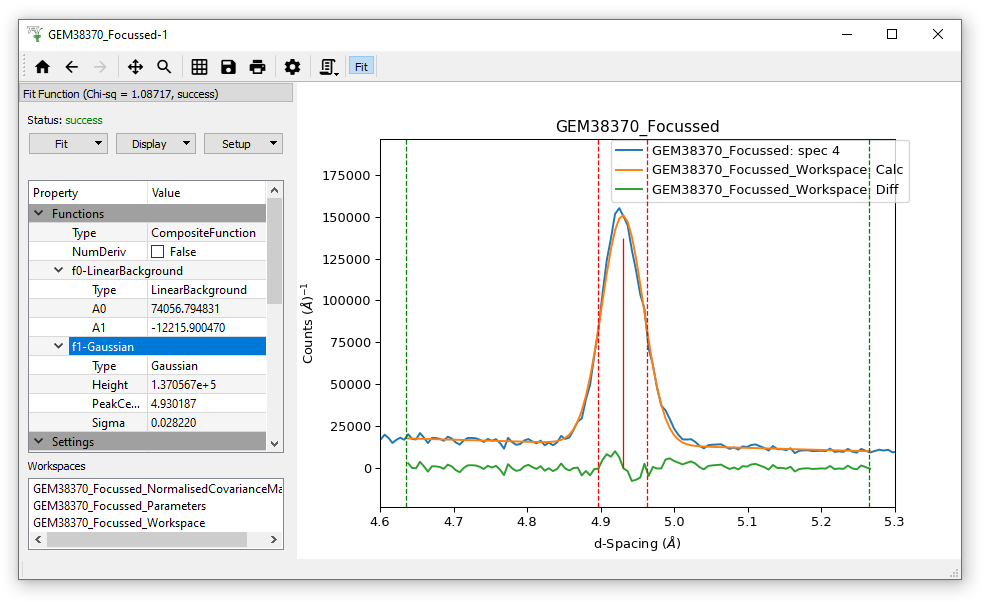
where the green line here is the Calculated fit
Optionally using a similar approach try to fit the spectrum in for example GEM63437_focussed_3