\(\renewcommand\AA{\unicode{x212B}}\)
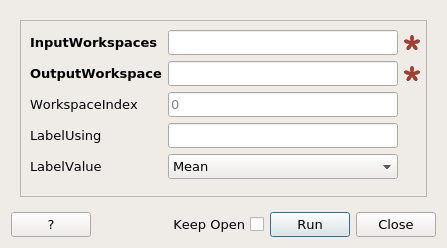
ConjoinSpectra dialog.
Table of Contents
| Name | Direction | Type | Default | Description |
|---|---|---|---|---|
| InputWorkspaces | Input | string | Mandatory | Comma seperated list of workspaces to use, group workspaces will automatically include all members. |
| OutputWorkspace | Output | Workspace | Mandatory | Name the workspace that will contain the result |
| WorkspaceIndex | Input | number | 0 | The workspace index of the spectra in each workspace to extract. Default: 0 |
| LabelUsing | Input | string | The name of a log value used to label the resulting spectra. Default: The source workspace name | |
| LabelValue | Input | string | Mean | How to derive the value from a time series property. Allowed values: [‘Mean’, ‘Median’, ‘Maximum’, ‘Minimum’, ‘First Value’] |
This algorithm allows a single spectrum to be extracted from a range of workspaces and placed into a single workspace for comparison and plotting. The LabelUsing property allows you to control what the end labels applied to each spectra will be. The default is to use the source workspace name, but you can specify the name of a log value to use as the label, e.g. Temp_Sample. the LabelValue property allows control of how a single value is extracted from time series logs.
| Example case with 3 input workspaces. | 
|
Example - Join workspace index 1 from three workspaces
ws = CreateSampleWorkspace("Histogram",BankPixelWidth=1)
ws2 = CreateSampleWorkspace("Histogram",BankPixelWidth=1)
ws3 = CreateSampleWorkspace("Histogram",BankPixelWidth=1)

wsOut = ConjoinSpectra("ws,ws2,ws3",WorkspaceIndex=1)
print("Creates a workspace with {} spectra labelled as".format(wsOut.getNumberHistograms()))
print(wsOut.getAxis(1).extractValues())
Output:
Creates a workspace with 3 spectra labelled as
['ws_1', 'ws2_1', 'ws3_1']
Example - Join spectra from three workspaces using a log value
ws = CreateSampleWorkspace("Histogram",BankPixelWidth=1)
ws2 = CreateSampleWorkspace("Histogram",BankPixelWidth=1)
ws3 = CreateSampleWorkspace("Histogram",BankPixelWidth=1)

#add some log values
wsIndex=0
for w in [ws,ws2,ws3]:
    wsIndex += 1
    for minute in range(60):
        time_string = "2010-01-01T00:%02i:00" % minute
        AddTimeSeriesLog(w, Name="myLog", Time=time_string, Value=(wsIndex*100)+minute)

wsOut = ConjoinSpectra("ws,ws2,ws3",WorkspaceIndex=0,LabelUsing="myLog",LabelValue="Mean")
print("Creates a workspace with {} spectra labelled using the Mean of myLog.".format(wsOut.getNumberHistograms()))
print(wsOut.getAxis(1).extractValues())

otherLabelValueOptions = ["First Value","Median", "Maximum", "Minimum"]
for labelValueOption in otherLabelValueOptions:
    wsOut = ConjoinSpectra("ws,ws2,ws3",WorkspaceIndex=0,LabelUsing="myLog", LabelValue=labelValueOption)
    print("Creates a workspace with {} spectra labelled using the {} of myLog.".format(wsOut.getNumberHistograms(), labelValueOption))
    print(wsOut.getAxis(1).extractValues())
Output:
Creates a workspace with 3 spectra labelled using the Mean of myLog.
['129.5', '229.5', '329.5']
Creates a workspace with 3 spectra labelled using the First Value of myLog.
['100.0', '200.0', '300.0']
Creates a workspace with 3 spectra labelled using the Median of myLog.
['129.5', '229.5', '329.5']
Creates a workspace with 3 spectra labelled using the Maximum of myLog.
['159.0', '259.0', '359.0']
Creates a workspace with 3 spectra labelled using the Minimum of myLog.
['100.0', '200.0', '300.0']
Categories: AlgorithmIndex | Transforms\Merging
Python: ConjoinSpectra.py