\(\renewcommand\AA{\unicode{x212B}}\)
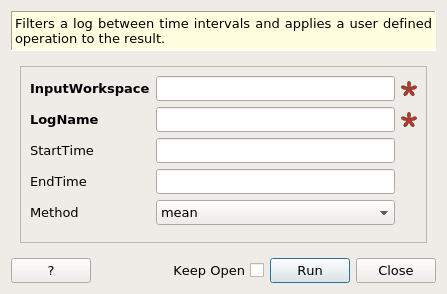
FilterLogByTime dialog.
Table of Contents
| Name | Direction | Type | Default | Description |
|---|---|---|---|---|
| InputWorkspace | Input | Workspace | Mandatory | Input workspace |
| LogName | Input | string | Mandatory | Log name to filter by |
| StartTime | Input | number | -1.7976931348623157e+308 | Start time for filtering. Seconds after run start |
| EndTime | Input | number | Optional | End time for filtering. Seconds after run start |
| Method | Input | string | mean | Statistical method to use to generate ResultStatistic output. Allowed values: [‘mean’, ‘min’, ‘max’, ‘median’] |
| FilteredResult | Output | dbl list | Filtered values between specified times. | |
| ResultStatistic | Output | number | Requested statistic |
Filters out logs that do not sit between StartTime and EndTime. The algorithm also applied a ‘Method’ to those filtered results and returns the statistic. A workspace must be provided containing logs. The log name provided must refer to a FloatTimeSeries log.
Unless specified, StartTime is taken to be run_start. StartTime and EndTime filtering is inclusive of the limits provided.
The Method allows you to create quick statistics on the filtered array
returned in the FilteredResult output argument. Therefore the return
value from Method=mean is equivalent to running numpy.mean() on the output
from the FilteredResult property. All the Method options map directly to
python numpy functions with the same name. These are documented
here
Example - Filtering a simple time series Log
ws = CreateSampleWorkspace("Histogram",BankPixelWidth=1)

AddTimeSeriesLog(ws, Name="proton_charge", Time="2010-01-01T00:00:00", Value=100)
AddTimeSeriesLog(ws, Name="proton_charge", Time="2010-01-01T00:10:00", Value=100)
AddTimeSeriesLog(ws, Name="proton_charge", Time="2010-01-01T00:20:00", Value=100)
AddTimeSeriesLog(ws, Name="proton_charge", Time="2010-01-01T00:30:00", Value=100)
AddTimeSeriesLog(ws, Name="proton_charge", Time="2010-01-01T00:40:00", Value=15)
AddTimeSeriesLog(ws, Name="proton_charge", Time="2010-01-01T00:50:00", Value=100)

print("Without a StartTime or EndTime all of the values are included")
(filtered_result,stat_result) = FilterLogByTime(ws,LogName="proton_charge")
print("The default statistic is mean: %i" % stat_result)
print("The filtered result is")
print(filtered_result)

(filtered_result,stat_result) = FilterLogByTime(ws,LogName="proton_charge", Method="max")
print("The max is: %i" % stat_result)
(filtered_result,stat_result) = FilterLogByTime(ws,LogName="proton_charge", Method="min")
print("The min is: %i" % stat_result)
(filtered_result,stat_result) = FilterLogByTime(ws,LogName="proton_charge", Method="median")
print("The median is: %i" % stat_result)
print("")

print("Adding a start time and optionally an end time allows you to filter the values")
(filtered_result,stat_result) = FilterLogByTime(ws,LogName="proton_charge",
    StartTime=580,EndTime = 1800)
print("The filtered mean is: %i" % stat_result)
print("The filtered result is")
print(filtered_result)
Output:
Without a StartTime or EndTime all of the values are included
The default statistic is mean: 85
The filtered result is
[ 100.  100.  100.  100.   15.  100.]
The max is: 100
The min is: 15
The median is: 100

Adding a start time and optionally an end time allows you to filter the values
The filtered mean is: 100
The filtered result is
[ 100.  100.  100.]
Categories: AlgorithmIndex | Events\EventFiltering
Python: FilterLogByTime.py