\(\renewcommand\AA{\unicode{x212B}}\)
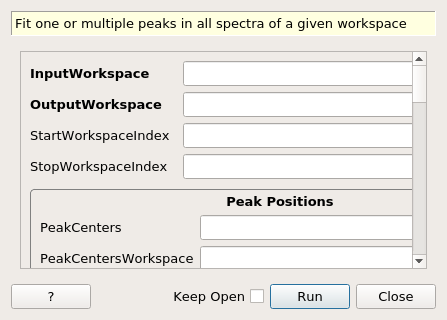
FitPeaks dialog.
Table of Contents
| Name | Direction | Type | Default | Description |
|---|---|---|---|---|
| InputWorkspace | Input | MatrixWorkspace | Mandatory | Name of the input workspace for peak fitting. |
| OutputWorkspace | Output | MatrixWorkspace | Mandatory | Name of the output workspace containing peak centers for fitting offset.The output workspace is point data.Each workspace index corresponds to a spectrum. Each X value ranges from 0 to N-1, where N is the number of peaks to fit. Each Y value is the peak position obtained by peak fitting. Negative value is used for error signals. -1 for data is zero; -2 for maximum value is smaller than specified minimum value.and -3 for non-converged fitting. |
| StartWorkspaceIndex | Input | number | Optional | Starting workspace index for fit |
| StopWorkspaceIndex | Input | number | Optional | Last workspace index to fit (which is included). If a value larger than the workspace index of last spectrum, then the workspace index of last spectrum is used. |
| PeakCenters | Input | dbl list | List of peak centers to fit against. | |
| PeakCentersWorkspace | Input | MatrixWorkspace | MatrixWorkspace containing peak centers | |
| PeakFunction | Input | string | Gaussian | Use of a BackToBackExponential profile is only reccomended if the coeficients to calculate A and B are defined in the instrument Parameters.xml file. Allowed values: [‘BackToBackExponential’, ‘Bk2BkExpConvPV’, ‘DeltaFunction’, ‘ElasticDiffRotDiscreteCircle’, ‘ElasticDiffSphere’, ‘ElasticIsoRotDiff’, ‘ExamplePeakFunction’, ‘Gaussian’, ‘IkedaCarpenterPV’, ‘Lorentzian’, ‘PseudoVoigt’, ‘Voigt’] |
| BackgroundType | Input | string | Linear | Type of Background. Allowed values: [‘Flat’, ‘Linear’, ‘Quadratic’] |
| FitWindowBoundaryList | Input | dbl list | List of left boundaries of the peak fitting window corresponding to PeakCenters. | |
| FitPeakWindowWorkspace | Input | MatrixWorkspace | MatrixWorkspace for of peak windows | |
| PeakWidthPercent | Input | number | Optional | The estimated peak width as a percentage of the d-spacing of the center of the peak. Value must be less than 1. |
| PeakParameterNames | Input | str list | List of peak parameters’ names | |
| PeakParameterValues | Input | dbl list | List of peak parameters’ value | |
| PeakParameterValueTable | Input | TableWorkspace | Name of the an optional workspace, whose each column corresponds to given peak parameter names, and each row corresponds to a subset of spectra. | |
| FitFromRight | Input | boolean | True | Flag for the order to fit peaks. If true, peaks are fitted from rightmost;Otherwise peaks are fitted from leftmost. |
| Minimizer | Input | string | Levenberg-Marquardt | Minimizer to use for fitting. Allowed values: [‘BFGS’, ‘Conjugate gradient (Fletcher-Reeves imp.)’, ‘Conjugate gradient (Polak-Ribiere imp.)’, ‘Damped GaussNewton’, ‘FABADA’, ‘Levenberg-Marquardt’, ‘Levenberg-MarquardtMD’, ‘Simplex’, ‘SteepestDescent’, ‘Trust Region’] |
| CostFunction | Input | string | Least squares | Cost functions. Allowed values: [‘Least squares’, ‘Rwp’] |
| MaxFitIterations | Input | number | 50 | Maximum number of function fitting iterations. |
| FindBackgroundSigma | Input | number | 1 | Multiplier of standard deviations of the variance for convergence of peak elimination. Default is 1.0. |
| HighBackground | Input | boolean | True | Flag whether the data has high background comparing to peaks’ intensities. For example, vanadium peaks usually have high background. |
| PositionTolerance | Input | dbl list | List of tolerance on fitted peak positions against given peak positions.If there is only one value given, then | |
| MinimumPeakHeight | Input | number | 0 | Minimum peak height such that all the fitted peaks with height under this value will be excluded. |
| ConstrainPeakPositions | Input | boolean | True | If true peak position will be constrained by estimated positions (highest Y value position) and the peak width either estimted by observation or calculate. |
| FittedPeaksWorkspace | Output | MatrixWorkspace | Name of the output matrix workspace with fitted peak. This output workspace have the same dimesion as the input workspace.The Y values belonged to peaks to fit are replaced by fitted value. Values of estimated background are used if peak fails to be fit. | |
| OutputPeakParametersWorkspace | Output | TableWorkspace | Mandatory | Name of table workspace containing all fitted peak parameters. |
| OutputParameterFitErrorsWorkspace | Output | TableWorkspace | Name of workspace containing all fitted peak parameters’ fitting error.It must be used along with FittedPeaksWorkspace and RawPeakParameters (True) | |
| RawPeakParameters | Input | boolean | True | false generates table with effective centre/width/height parameters. true generates a table with peak function parameters |
This algorithm fits a set of specified peaks in a set of specified spectra in a MatrixWorkspace,
returning a list of the successfully fitted peaks along with
optional output for fitting information.
The list of candidate peaks found is passed to a fitting routine and
those that are successfully fitted are kept and returned in the output
workspace (and logged at information level). The output
TableWorkspace
contains the following columns,
which reflect the fact that the peak has been fitted to a Gaussian atop
a linear background: spectrum, centre, width, height,
backgroundintercept & backgroundslope.
It is assumed that the profile parameters of a peak at a given d-spacing, such as the peak width, are correlated between adjacent spectra (in index).
The following information are required.
For each spectrum, it is assumed that there are N peaks to fit. The fitting starts from either the peak at the smallest X value or the largest X values depending on the user’s input. The first peak will be fit with the starting value provided by the user. except background and peak center, which will be determiend by observation.
Linear background is used for fitting peaks. The background parameters will be estimated via observation.
Peak height, center, and FWHM and peak center are estimated by observing the maximum value within peak fit window and calculating the first two moments.
When using peak profiles that do not have a one-to-one mapping between
effective and raw parameters, you may need to supply starting
information for more of the parameters. This can be done by specifying
PeakParameterNames and PeakParameterValues for some or all of
the parameters (e.g. Mixing for a PseudoVoigt) which
will be used for the first peak fit in each spectrum. To supply all
parameters, PeakParameterNames and PeakParameterValueTable can
be used. WARNING Partially specifying peak parameters such as
height and position will be overwritten by observed values.
FitPeaks uses the Fit algorithm to fit each single peak.
FitPeaks uses the FindPeakBackground algorithm to estimate the background of each peak.
One of only one of the following will be taken.
MatrixWorkspacem_peakCenterWorkspace.FitPeaks can work on partial spectra.m_peakCentersPeaks’ positions must be given in ascending order
Parameter FitFromRight deontes start fits from right most peak rather than left most peak.
There are two input parameters that are associated with fitting window.
If FitWindows is defined, then a peak’s range to fit (i.e., x-min and x-max) is confined by this window.
If FitWindows is defined, starting peak centres are NOT user’s input, but found by highest value within peak window. (Is this correct???)
Further down the road, here are the fitting setup that can be affected.
Tolerance will be always checked!
PeakParameterValues such that the starting values are uniform among all spectra.PeakParameterValueTable such that the starting values are not necessary same among all spectra.FitPeaks supports estimating peak parameter names as starting values.
Estimate-peak-background takes peak fit window for pre-knowledge, and calculate a and b in the linear background function.
The algorithm is 1. Find the left and right N points respectively, average both x and y value 2. Use \((\bar{x}_1, \bar{y}_1)\) and \((\bar{x}_2, \bar{y}_2)\) to calculate a and b in \(y = a\cdot x + b\)
Estimate-peak-parameters requires background parameters being estimated.
Here is the approach to estimate the peak parameters
Estimate-peak-range requires inputs including expected peak center, fit window and estimated right and left FWHM. It will output the left and right boundary of the peak such that the background can be fit by excluding the peak.
Reduce the background by finding a linear function \(B_i = a\cdot x_i + b\), such that \(\sum_i (Y_i - B_i)\) is minimum while any \(Y_i - B_i\) is non-negative.
This approach is good for any background close to linear within the fit window.
With the background reduced in step 1, it will be more reliable to estimate the peak’s FWHM via observation.
Algorithm FitPeaks is designed for various purposes including but not limited to vanadium peak striping and fitting diamond peaks to calibrate detectors’ positions.
On the other hand, due to the complexity in peak fitting, users prefer to check the fitting results.
Therefore, FitPeaks supports various fexible and informative outputs.
It is a MatrixWorkspace containing the peak positions expected and fitted.
MinimumWorkspaceIndex and MaximumWorkspaceIndex.It is an output MatrixWorkspace containing function parameters’ fitted values
for all peaks that are specified to fit.
The order of the peaks will be exactly the sequence of peaks as the order of the given positions of peaks.
If user specifies a subset of spectra to fit, this TableWorksapce will only contain function parameters’ value that corresponds to the spectra that are fitted.
It is an optional output MatrixWorkspace containing function parameters’ fitting error,
i.e., uncertainties, for all peaks that are specified to fit.
The order of the peaks will be exactly the sequence of peaks as the order of the given positions of peaks.
If user specifies a subset of spectra to fit, this TableWorksapce will only contain function parameters’ uncertainties that corresponds to the spectra that are fitted.
It has one less column than OutputPeakParametersWorkspace, which is chi2.
It is an optional output MatrixWorkspace containing the peaks
calculated from fitting result.
It is a MatrixWorkspace recording the cost of each peak that is fitted.
It is in the exactly same order as the given positions of peaks to fit.
Its X values store the fitted peak positions and Y values are for \(\chi^2\).
If a peak’s fitting is bad, then the peak position will be its proposed peak position, while its \(\chi^2\) shall be some special value.
It is an optional output MatrixWorkspace.
For each spectrum, in each fit window, the Y values will be replaced by the calculated peak and background value. If fitting is bad, then only background is calculated.
Example - Find a single peak:
ws = CreateSampleWorkspace(Function="User Defined",
                           UserDefinedFunction="name=LinearBackground, A0=0.3;name=Gaussian, PeakCentre=5, Height=10, Sigma=0.7",
                           NumBanks=1, BankPixelWidth=1, XMin=0, XMax=10, BinWidth=0.1)

FitPeaks(InputWorkspace='ws', PeakCenters='5.1', FitWindowBoundaryList='0,10', OutputPeakParametersWorkspace='fitted_params',
         BackgroundType='Linear', FittedPeaksWorkspace='fitted', OutputWorkspace='peakpositions')

peakposws = mtd['peakpositions']
param_ws = mtd['fitted_params']
row = param_ws.row(0)

# output
print ('Fitted peak position: {0:.5f}'.format(peakposws.readY(0)[0]))
print ("Peak 0  Centre: {0:.5f}, width: {1:.5f}, height: {2:.5f}".format(row["PeakCentre"], row["Sigma"], row["Height"]))

# clean up workspaces
DeleteWorkspace(Workspace='fitted')
DeleteWorkspace(Workspace='fitted_params')
DeleteWorkspace(Workspace='ws')
DeleteWorkspace(Workspace='peakpositions')
Output:
Fitted peak position: 5.05000
Peak 0  Centre: 5.05000, width: 0.70000, height: 10.00000
Example - Fit peaks on high background (vanadium):
# load a 4 spectra workspace
ws = Load("PG3_733.nxs")

van_peak_centers = "0.5044,0.5191,0.5350,0.5526,0.5936,0.6178,0.6453,0.6768,0.7134,0.7566,0.8089,0.8737,0.9571,1.0701,1.2356,1.5133,2.1401"
FitPeaks(InputWorkspace=ws, StartWorkspaceIndex=0, StopWorkspaceIndex=3,PeakCenters=van_peak_centers,
           FitFromRight=True,HighBackground=True,
           BackgroundType='Quadratic',
           PeakWidthPercent=0.008,
           OutputWorkspace='PG3_733_peak_positions',OutputPeakParametersWorkspace='PG3_733_peak_params',
           FittedPeaksWorkspace='PG3_733_fitted_peaks')

PG3_733_peak_positions = mtd["PG3_733_peak_positions"]
ep0 = PG3_733_peak_positions.readX(0)[-1]
ep1 = PG3_733_peak_positions.readX(0)[-2]
ep2 = PG3_733_peak_positions.readX(0)[-3]
fp0 = PG3_733_peak_positions.readY(0)[-1]
fp1 = PG3_733_peak_positions.readY(0)[-2]
fp2 = PG3_733_peak_positions.readY(0)[-3]

# print data
print ('Spectrum 1: Expected right most 3 peaks at {0:.7f}, {1:.7f}, {2:.7f}'.format(ep0, ep1, ep2))
print ('Spectrum 1: Found    right most 3 peaks at {0:.7f}, {1:.7f}, {2:.7f}'.format(fp0, fp1, fp2))

# delete workspaces
DeleteWorkspace(Workspace='PG3_733_peak_positions')
DeleteWorkspace(Workspace='PG3_733_fitted_peaks')
DeleteWorkspace(Workspace='PG3_733_peak_params')
DeleteWorkspace(Workspace='ws')
Output:
Spectrum 1: Expected right most 3 peaks at 2.1401000, 1.5133000, 1.2356000
Spectrum 1: Found    right most 3 peaks at 2.1485553, 1.5190662, 1.2404027
Example - Fit back-to-back exponential peaks (Vulcan diamond):
# load data
Load(Filename="vulcan_diamond.nxs", OutputWorkspace="diamond_3peaks")

FitPeaks(InputWorkspace="diamond_3peaks", StartWorkspaceIndex=0, StopWorkspaceIndex=5,
       PeakCenters="0.6867, 0.728299, 0.89198, 1.0758",
       PeakFunction="BackToBackExponential", BackgroundType="Linear",
       FitWindowBoundaryList="0.67, 0.709, 0.71, 0.76, 0.87, 0.92, 1.05, 1.1",
       PeakParameterNames="I, A, B, X0, S",
       PeakParameterValues="2.5e+06, 5400, 1700, 1.07, 0.000355",
       FitFromRight=True,
       HighBackground=False,
       OutputWorkspace="diamond_peaks_centers",
       OutputPeakParametersWorkspace="PeakParametersWS2",
       FittedPeaksWorkspace="FittedPeaksWS2")

fitted_peak_pos_ws = mtd['diamond_peaks_centers']

# print result
for ws_index in range(0, 1):
    print ('Spectrum {0}:'.format(ws_index+1))
    for peak_index in range(2, 4):
        exp_pos = fitted_peak_pos_ws.readX(ws_index)[peak_index]
        fit_pos = fitted_peak_pos_ws.readY(ws_index)[peak_index]
        print ('Expected @ {0:.3f}  Fitted @ {1:.3f}'.format(exp_pos, fit_pos))

# clean
DeleteWorkspace(Workspace='diamond_3peaks')
DeleteWorkspace(Workspace='diamond_peaks_centers')
DeleteWorkspace(Workspace='FittedPeaksWS2')
DeleteWorkspace(Workspace='PeakParametersWS2')
Output:
Spectrum 1:
Expected @ 0.892  Fitted @ 0.892
Expected @ 1.076  Fitted @ 1.075
Categories: AlgorithmIndex | Optimization