\(\renewcommand\AA{\unicode{x212B}}\)
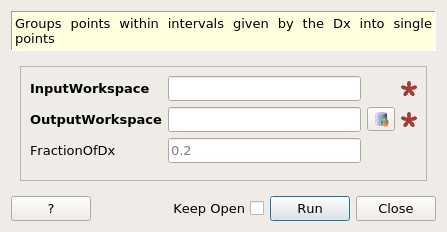
GroupToXResolution dialog.
Table of Contents
| Name | Direction | Type | Default | Description |
|---|---|---|---|---|
| InputWorkspace | Input | MatrixWorkspace | Mandatory | An input workspace with Dx values. |
| OutputWorkspace | Output | MatrixWorkspace | Mandatory | The grouped workspace. |
| FractionOfDx | Input | number | 0.2 | A fraction of Dx to group the points to. |
This algorithm groups the points of a single histogram workspace according to the X resolution stored in the DX array.
The figure below shows schematically how the grouping procedure proceeds.
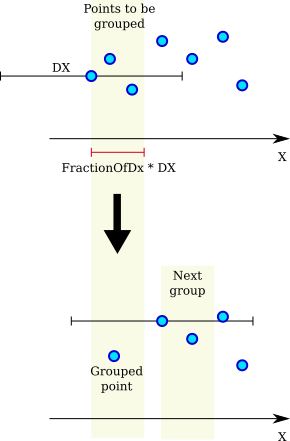
FractionOfDx * \(D_{i}\).Example - Grouping points to X resolution
from mantid.simpleapi import CreateWorkspace, DeleteWorkspaces, GroupToXResolution
import matplotlib.pyplot as plt
import numpy as np
# Create a workspace with exponential decay.
Xs = np.arange(0.01, 5., 0.01)
Ys = np.exp(-Xs)
# A clumsy way for filling a numpy array.
# Numpy version > 1.7 would support 'DXs = full_like(Ys, 1.)'
DXs = np.empty_like(Ys)
DXs.fill(1.)
original = CreateWorkspace(Xs, Ys, Dx=DXs, NSpec=1)
grouped = GroupToXResolution(original)
# Plot side-by-side comparison.
fig, (left, right) = plt.subplots(ncols=2, subplot_kw={'projection':'mantid'})
left.errorbar(original, linestyle='None')
left.set_title('Original')
right.errorbar(grouped, linestyle='None')
right.set_title('Grouped')
# Uncomment the next line to show the plot window.
#fig.show()
DeleteWorkspaces(['original', 'grouped'])
(Source code, png, hires.png, pdf)

Categories: AlgorithmIndex | Transforms\Rebin