\(\renewcommand\AA{\unicode{x212B}}\)
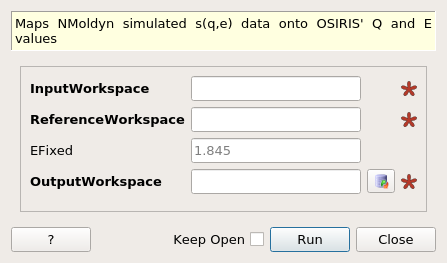
NMoldyn4Interpolation dialog.
Table of Contents
| Name | Direction | Type | Default | Description |
|---|---|---|---|---|
| InputWorkspace | Input | Workspace | Mandatory | Simulated workspace |
| ReferenceWorkspace | Input | Workspace | Mandatory | Reference OSIRIS workspace to provide values |
| EFixed | Input | number | 1.845 | EFixed value of OSIRIS data (should be default in almost all circumstances) |
| OutputWorkspace | Output | Workspace | Mandatory | Output Workspace of remapped simulation data |
Given simulated s(q,e) data workspace and a reference OSIRIS s(q,e) workspace, interpolates the simulated data onto the same (q, e) grid as the reference workspace. This allows direct comparison between simulated and experimental data upon the same axes. Currently only supports OSIRIS experimental data.
Example 1 - Interpolate a simulated data set onto the axes of an experimental set
#create a simulated S(Q,E) workspace of a sin function
x_data = np.arange(-2., 2., 0.05)
q_data = np.arange(0.5, 1.3, 0.1)
y_data = np.asarray([val*(np.cos(5*x_data)+1) for val in q_data])
y_data = y_data.flatten()
x_data = np.tile(x_data, len(q_data))
sim_ws= CreateWorkspace(DataX=x_data, DataY=y_data, NSpec = len(q_data),
                        VerticalAxisUnit='MomentumTransfer',
                        VerticalAxisValues=q_data)
#create an empty OSIRIS workspace (this would be your experimental OSIRIS resolution function)
idf_dir = config['instrumentDefinition.directory']
osiris = LoadEmptyInstrument(idf_dir + 'OSIRIS_Definition.xml')
osiris = CropWorkspace(osiris,  StartWorkspaceIndex=970, EndWorkspaceIndex=980)
osiris = Rebin(osiris, [-0.6, 0.02, 0.6])
#interpolate the two workspaces
interpolated_ws = NMoldyn4Interpolation(sim_ws, osiris)
print('No. of Q-values in simulation = {}'.format(sim_ws.getNumberHistograms()))
print('No. of Q-values in reference = {}'.format(osiris.getNumberHistograms()))
print('No. of Q-values in interpolated set = {}'.format(interpolated_ws.getNumberHistograms()))
Output:
No. of Q-values in simulation = 8
No. of Q-values in reference = 11
No. of Q-values in interpolated set = 11
Categories: AlgorithmIndex | Simulation | Inelastic\DataHandling
Python: NMoldyn4Interpolation.py