\(\renewcommand\AA{\unicode{x212B}}\)
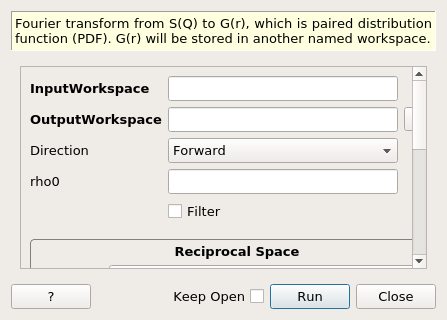
PDFFourierTransform dialog.
Table of Contents
Fourier transform from S(Q) to G(r), which is paired distribution function (PDF). G(r) will be stored in another named workspace.
| Name | Direction | Type | Default | Description |
|---|---|---|---|---|
| InputWorkspace | Input | MatrixWorkspace | Mandatory | Input spectrum density or paired-distribution function |
| OutputWorkspace | Output | MatrixWorkspace | Mandatory | Result paired-distribution function or Input spectrum density |
| Direction | Input | string | Forward | The direction of the fourier transform. Allowed values: [‘Forward’, ‘Backward’] |
| rho0 | Input | number | Optional | Average number density used for g(r) and RDF(r) conversions (optional) |
| Filter | Input | boolean | False | Set to apply Lorch function filter to the input |
| InputSofQType | Input | string | S(Q) | To identify spectral density function (deprecated). Allowed values: [‘S(Q)’, ‘S(Q)-1’, ‘Q[S(Q)-1]’] |
| SofQType | Input | string | S(Q) | To identify spectral density function. Allowed values: [‘S(Q)’, ‘S(Q)-1’, ‘Q[S(Q)-1]’] |
| DeltaQ | Input | number | Optional | Step size of Q of S(Q) to calculate. Default = \(\frac{\pi}{R_{max}}\). |
| Qmin | Input | number | Optional | Minimum Q in S(Q) to calculate in Fourier transform (optional). |
| Qmax | Input | number | Optional | Maximum Q in S(Q) to calculate in Fourier transform. (optional, defaults to 40 on backward transform.) |
| PDFType | Input | string | G(r) | Type of output PDF including G(r). Allowed values: [‘G(r)’, ‘g(r)’, ‘RDF(r)’] |
| DeltaR | Input | number | Optional | Step size of r of G(r) to calculate. Default = \(\frac{\pi}{Q_{max}}\). |
| Rmin | Input | number | Optional | Minimum r for G(r) to calculate. (optional) |
| Rmax | Input | number | Optional | Maximum r for G(r) to calculate. (optional, defaults to 20 on forward transform.) |
The algorithm transforms a single spectrum workspace containing spectral density \(S(Q)\), \(S(Q)-1\), or \(Q[S(Q)-1]\) (as a function of MomentumTransfer or dSpacing units) to a PDF (pair distribution function) as described below and also the reverse. The available PDF types are the reduced pair distribution function \(G(r)\), the pair distribution function \(g(r)\), and the radial distribution function \(RDF(r)\).
The output from this algorithm will have an x-range between 0.0 and the maximum parameter of the output, i.e. if converting from g(r) to S(Q) the output will be between 0.0 and Qmax.
The spectrum density should be in the Q-space (MomentumTransfer) units . (d-spacing is not supported any more. Contact development team to fix that and enable dSpacing again)
\(g(r) = \rho(r)/\rho_0 = 1+\frac{1}{2\pi^2\rho_0r} \int_{0}^{\infty} Q[S(Q)-1]\sin(Qr)dQ\)
and in this algorithm, it is implemented as
\(g(r)-1 = \frac{1}{2\pi \rho_0 r^3} \sum_{Q_{min}}^{Q_{max}} M(Q,Q_{max})(S(Q)-1)[\sin(Qr) - Qr\cos(Qr)]^{right bin}_{left bin}\)
where \(M(Q,Q_{max})\) is an optional filter function. If Filter property is set (true) then
\(M(Q,Q_{max}) = \frac{\sin(\pi Q/Q_{max})}{\pi Q/Q_{max}}\)
otherwise
\(M(Q,Q_{max}) = 1\,\)
Example - PDF transformation examples:
# Simulates Load of a workspace with all necessary parameters
import numpy as np;
xx = np.array(range(0,100))*0.1
yy = np.exp(-(2.0 * xx)**2)
yy = np.delete(yy,-1) # need one less Y value than X value for histogram data
ws = CreateWorkspace(DataX=xx, DataY=yy, UnitX='MomentumTransfer')
Rt = PDFFourierTransform(ws, SofQType='S(Q)-1', PDFType='g(r)')

# Look at sample results:
print('part of S(Q)-1 and its correlation function')
for i in range(10):
   print('! {0:4.2f} ! {1:5f} ! {2:f} ! {3:5f} !'.format(xx[i], yy[i], Rt.readX(0)[i], Rt.readY(0)[i]))
Output:
part of S(Q)-1 and its correlation function
! 0.00 ! 1.000000 ! 0.317333 ! 1.003494 !
! 0.10 ! 0.960789 ! 0.634665 ! 1.003423 !
! 0.20 ! 0.852144 ! 0.951998 ! 1.003308 !
! 0.30 ! 0.697676 ! 1.269330 ! 1.003154 !
! 0.40 ! 0.527292 ! 1.586663 ! 1.002965 !
! 0.50 ! 0.367879 ! 1.903996 ! 1.002750 !
! 0.60 ! 0.236928 ! 2.221328 ! 1.002515 !
! 0.70 ! 0.140858 ! 2.538661 ! 1.002269 !
! 0.80 ! 0.077305 ! 2.855993 ! 1.002018 !
! 0.90 ! 0.039164 ! 3.173326 ! 1.001770 !
Categories: AlgorithmIndex | Diffraction\Utility