\(\renewcommand\AA{\unicode{x212B}}\)

PlotPeakByLogValue dialog.
Table of Contents
| Name | Direction | Type | Default | Description |
|---|---|---|---|---|
| Input | Input | string | Mandatory | A list of sources of data to fit. Sources can be either workspace names or file names followed optionally by a list of spectra/workspace-indices or values using the notation described in the description section of the help page. |
| Spectrum | Input | number | 1 | Set a spectrum to fit. However, if spectra lists (or workspace-indices/values lists) are specified in the Input parameter string these take precedence. |
| WorkspaceIndex | Input | number | 0 | Set a workspace-index to fit (alternative option to Spectrum). However, if spectra lists (or workspace-indices/values lists) are specified in the Input parameter string, or the Spectrum parameter integer, these take precedence. |
| OutputWorkspace | Output | TableWorkspace | Mandatory | The output TableWorkspace |
| Function | InOut | Function | Mandatory | Parameters defining the fitting function and its initial values |
| LogValue | Input | string | Name of the log value to plot the parameters against. Default: use spectra numbers. | |
| StartX | Input | dbl list | A value of x in, or on the low x boundary of, the first bin to include in the fit (default lowest value of x) | |
| EndX | Input | dbl list | A value in, or on the high x boundary of, the last bin the fitting range (default the highest value of x) | |
| FitType | Input | string | Sequential | Defines the way of setting initial values. If set to ‘Sequential’ every next fit starts with parameters returned by the previous fit. If set to ‘Individual’ each fit starts with the same initial values defined in the Function property. Allowed values: [‘Sequential’, ‘Individual’] |
| PassWSIndexToFunction | Input | boolean | False | For each spectrum in Input pass its workspace index to all functions thathave attribute WorkspaceIndex. |
| Minimizer | Input | string | Levenberg-Marquardt | Minimizer to use for fitting. Minimizers available are ‘Levenberg-Marquardt’, ‘Simplex’, ‘FABADA’, ‘Conjugate gradient (Fletcher-Reeves imp.)’, ‘Conjugate gradient (Polak-Ribiere imp.)’ and ‘BFGS’ |
| CostFunction | InOut | string | Least squares | Cost functions to use for fitting. Cost functions available are ‘Least squares’ and ‘Ignore positive peaks’. Allowed values: [‘Least squares’, ‘Poisson’, ‘Rwp’, ‘Unweighted least squares’] |
| MaxIterations | Input | number | 500 | Stop after this number of iterations if a good fit is not found |
| PeakRadius | Input | number | 0 | A value of the peak radius the peak functions should use. A peak radius defines an interval on the x axis around the centre of the peak where its values are calculated. Values outside the interval are not calculated and assumed zeros.Numerically the radius is a whole number of peak widths (FWHM) that fit into the interval on each side from the centre. The default value of 0 means the whole x axis. |
| CreateOutput | Input | boolean | False | Set to true to create output workspaces with the results of the fit(default is false). |
| OutputCompositeMembers | Input | boolean | False | If true and CreateOutput is true then the value of each member of a Composite Function is also output. |
| ConvolveMembers | Input | boolean | False | If true and OutputCompositeMembers is true members of any Convolution are output convolved with corresponding resolution |
| EvaluationType | Input | string | CentrePoint | The way the function is evaluated: CentrePoint or Histogram. Allowed values: [‘CentrePoint’, ‘Histogram’] |
| Exclude | Input | dbl list | A list of pairs of real numbers, defining the regions to exclude from the fit for all spectra. | |
| ExcludeMultiple | Input | str list | A list of Exclusion ranges, defining the regions to exclude from the fit for each spectra. Must have the same number of sets as the number of the spectra. | |
| IgnoreInvalidData | Input | boolean | False | Flag to ignore infinities, NaNs and data with zero errors. |
| OutputFitStatus | Input | boolean | False | Flag to output fit status information which consists of the fit OutputStatus and the OutputChiSquared |
This algorithm fits a series of spectra with the same function. Each spectrum is fit independently and the result is a table of fitting parameters unique for each spectrum. The sources for the spectra are defined in the Input property. The Input property expects a list of spectra identifiers separated by semicolons (;). An identifier is itself a comma-separated list of values. The first value is the name of the source. It can be either a workspace name or a name of a file (RAW or Nexus). If it is a name of a WorkspaceGroup all its members will be included in the fit. The second value selects a spectrum within the workspace or file. It is an integer number with a prefix defining the meaning of the number: “sp” for a spectrum number, “i” for a workspace index, or “v” for a range of values on the numeric axis associated with the workspace index. For example, sp12, i125, v0.5:2.3. If the data source is a file only the spectrum number option is accepted. The third value of the spectrum identifier is optional period number. It is used if the input file contains multiperiod data. In case of workspaces this third parameter is ignored. This are examples of Input property
Internally PlotPeakByLogValue uses Fit v1 algorithm to perform fitting and the following properties have the same meaning as in Fit v1: StartX, EndX, Minimizer, CostFunction. Property FitType defines the way of setting initial values. If it is set to “Sequential” every next fit starts with parameters returned by the previous fit. If set to “Individual” each fit starts with the same initial values defined in the Function property.
The Function property can be a single domain function in which case this function is used to fit each of the inputs, or it can be a multi-domain function. In the latter case the number of domains must equal the number of inputs and each input is fitted to the equivalent function from the multi-domain function.
LogValue property specifies a log value to be included into the output. If this property is empty the values of axis 1 will be used instead. Setting this property to “SourceName” makes the first column of the output table contain the names of the data sources (files or workspaces).
PlotPeakByLogValue_Output.png
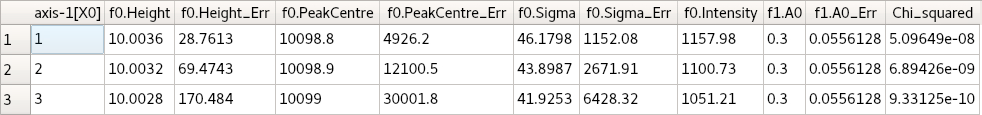
In this example a group of three Matrix workspaces were fitted with a Gaussian on a linear background.
The output workspace is a table in which rows correspond to the spectra in the order they (spectra) appear in the Input property. The first column of the table has the log values. It is followed by pairs of columns with parameter values and fitting errors. If a parameter was fixed or tied the error will be zero. If the function being fitted is a Peak function, a column for its integrated intensity is added after its parameter columns. Here is an example of the output workspace:
It is possible to supply a fully configured minimizer via the Minimizer property, this can also include several flags that are used to indicate the workspace name and workspace index that has been fitted (useful for fitting using a minimizer that output workspaces (i.e. FABADA)).
The possible flags are:
$wsname$wsindex$basename$wsname_$wsindex (the same format the fit
result and parameter output takes)$outputname$OutputFitStatusIt is possible to include exclusion regions that will not be used when calculating the fit. This can be done with the Exclude parameter which will use the same range for each spectra being fitted. This range is given as a list or string containing an even number of values defining exclusion boundaries e.g. “-0.1, -0.05, 0.05, 0.3” will exclude values between -0.1 and -0.05, and 0.05 and 0.3. If each spectra requires different exclusion ranges ExcludeMultiple can be used, this parameter contains a list of Exclude style parameters. For example if there are 3 spectra being fitted the to use ExcludeMultiple you would need to give a list with 3 values e.g. [“-0.1, -0.05”, “0.05, 0.3”, “0.0,0.0”] will mask the first between -0.1 and -0.05, the second between 0.05 and 0.3. The third spectra will me masked between 0.0 and 0.0 i.e. it will not be masked.
Example - fitting a single spectrum of in a workspace:
ws = CreateSampleWorkspace()
function = "name=Gaussian,Height=10.0041,PeakCentre=10098.6,Sigma=48.8581;name=FlatBackground,A0=0.3"
peaks = PlotPeakByLogValue(ws, function, Spectrum=1)
Example - sequentially fitting a workspace:
import numpy as np

ws = CreateSampleWorkspace()
function = "name=Gaussian,Height=10.0041,PeakCentre=10098.6,Sigma=48.8581;name=FlatBackground,A0=0.3"

#create string of workspaces to fit (ws,i0; ws,i1, ws,i2 ...)
workspaces = [ws.name() + ',i%d' % i for i in range(ws.getNumberHistograms())]
workspaces = ';'.join(workspaces)

peaks = PlotPeakByLogValue(workspaces, function, Spectrum=1)

#get peak centres for comparison
peak_centres = peaks.column('f0.PeakCentre')
ref = np.empty(len(peak_centres))
ref.fill(10098.6)

print(np.allclose(ref, peak_centres, 1e-3))
Output:
True
Example - sequentially fitting a workspace with Output Status:
import numpy as np

ws = CreateSampleWorkspace()
function = "name=Gaussian,Height=10.0041,PeakCentre=10098.6,Sigma=48.8581;name=FlatBackground,A0=0.3"

#create string of workspaces to fit (ws,i0; ws,i1, ws,i2 ...)
workspaces = [ws.name() + ',i%d' % i for i in range(ws.getNumberHistograms())]
workspaces = ';'.join(workspaces)

peaks, status, chi2 = PlotPeakByLogValue(workspaces, function, Spectrum=1, OutputFitStatus=True)

# Print status of first 10 fits
print("Fit status = {}".format(status[0:10]))
print("Fit chi2 = {}".format(chi2[0:10]))
Output:
Fit status = ['success', 'success', 'success', 'success', 'success', 'success', 'success', 'success', 'success', 'success']
Fit chi2 = [  5.09648779e-08   6.89426130e-09   9.33124574e-10   1.26539259e-10
   1.73025195e-11   2.45555803e-12   4.06465408e-13   1.04496124e-13
   4.79987355e-14   3.01813222e-14]
Example - Fitting multiDomain function:
ws = CreateSampleWorkspace()
function = mantid.api.FunctionFactory.createInitializedMultiDomainFunction("name=Gaussian,Height=10.0041,PeakCentre=10098.6,Sigma=48.8581;name=FlatBackground,A0=0.3", 200)

#create string of workspaces to fit (ws,i0; ws,i1, ws,i2 ...)
workspaces = [ws.name() + ',i%d' % i for i in range(ws.getNumberHistograms())]
workspaces = ';'.join(workspaces)

peaks, status, chi2 = PlotPeakByLogValue(workspaces, function, Spectrum=1, OutputFitStatus=True)

# Print status of first 10 fits
print("Fit status = {}".format(status[0:10]))
print("Fit chi2 = {}".format(chi2[0:10]))
Output:
Fit status = ['success', 'success', 'success', 'success', 'success', 'success', 'success', 'success', 'success', 'success']
Fit chi2 = [  5.09648779e-08   6.89426130e-09   9.33124574e-10   1.26539259e-10
   1.73025195e-11   2.45555803e-12   4.06465408e-13   1.04496124e-13
   4.79987355e-14   3.01813222e-14]
Example - :
ws = CreateSampleWorkspace(BankPixelWidth=3)
function = "name=Gaussian,Height=10.0041,PeakCentre=10098.6,Sigma=48.8581;name=FlatBackground,A0=0.3"

#create string of workspaces to fit (ws,i0; ws,i1, ws,i2 ...)
workspaces = [ws.name() + ',i%d' % i for i in range(3)]
workspaces = ';'.join(workspaces)

exclude_range = ["5000,7500", "7500,12500", "0.0,0.0"]

peaks, status, chi2 = PlotPeakByLogValue(workspaces, function, Spectrum=1, OutputFitStatus=True, ExcludeMultiple=exclude_range)

# Print status of first 10 fits
print("Fit status = {}".format(status[0:3]))
print("Fit chi2 = [{0:.4e}, {1:.4e}, {2:.4e}]".format(chi2[0], chi2[1], chi2[2]))
Output:
Fit status = ['success', 'success', 'success']
Fit chi2 = [5.0965e-08, 0.0000e+00, 6.8943e-09]
Categories: AlgorithmIndex | Optimization