\(\renewcommand\AA{\unicode{x212B}}\)
PoldiPeakSummary dialog.
Table of Contents
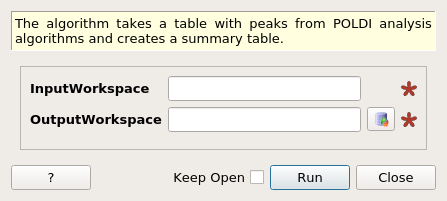
The algorithm takes a table with peaks from POLDI analysis algorithms and creates a summary table.
| Name | Direction | Type | Default | Description |
|---|---|---|---|---|
| InputWorkspace | Input | TableWorkspace | Mandatory | Input workspace containing a table with peaks from a POLDI fit routine. |
| OutputWorkspace | Output | TableWorkspace | Output table workspace that contains |
This algorithm takes the peak table resulting from one of the POLDI peak fitting routines (for example PoldiFitPeaks1D v2) and summarizes the data in another table with the relevant information.
Note
To run these usage examples please first download the usage data, and add these to your path. In Mantid this is done using Manage User Directories.
Example - PoldiPeakSummary
# Load data file and instrument, perform correlation analysis
raw_6904 = LoadSINQFile(Filename = "poldi2013n006904.hdf", Instrument = "POLDI")
LoadInstrument(raw_6904, RewriteSpectraMap=True, InstrumentName = "POLDI")
correlated_6904 = PoldiAutoCorrelation(raw_6904)

# Run peak search algorithm, store peaks in TableWorkspace
peaks_6904 = PoldiPeakSearch(correlated_6904)

PoldiFitPeaks1D(InputWorkspace = correlated_6904, FwhmMultiples = 4.0,
                PeakFunction = "Gaussian", PoldiPeakTable = peaks_6904,
                OutputWorkspace = "peaks_refined_6904",
                FitPlotsWorkspace = "fit_plots_6904")

summary_6904 = PoldiPeakSummary(mtd["peaks_refined_6904"])

print("Number of refined peaks: {}".format(summary_6904.rowCount()))
print("Number of columns that describe a peak: {}".format(summary_6904.columnCount()))
Output:
Number of refined peaks: 13
Number of columns that describe a peak: 6
Categories: AlgorithmIndex | SINQ\Poldi