\(\renewcommand\AA{\unicode{x212B}}\)
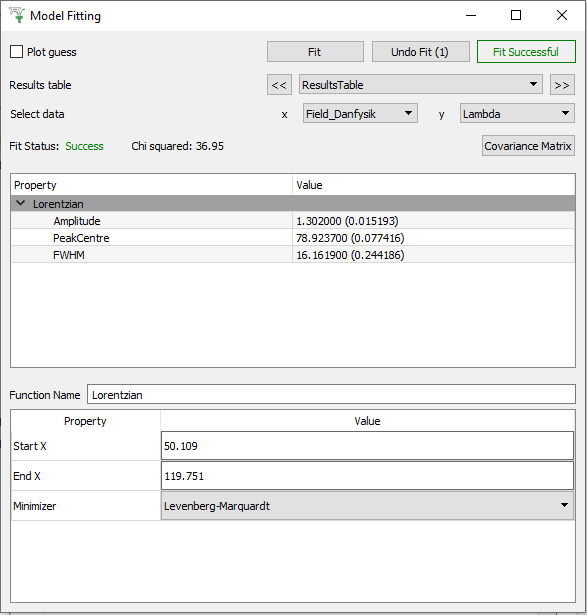
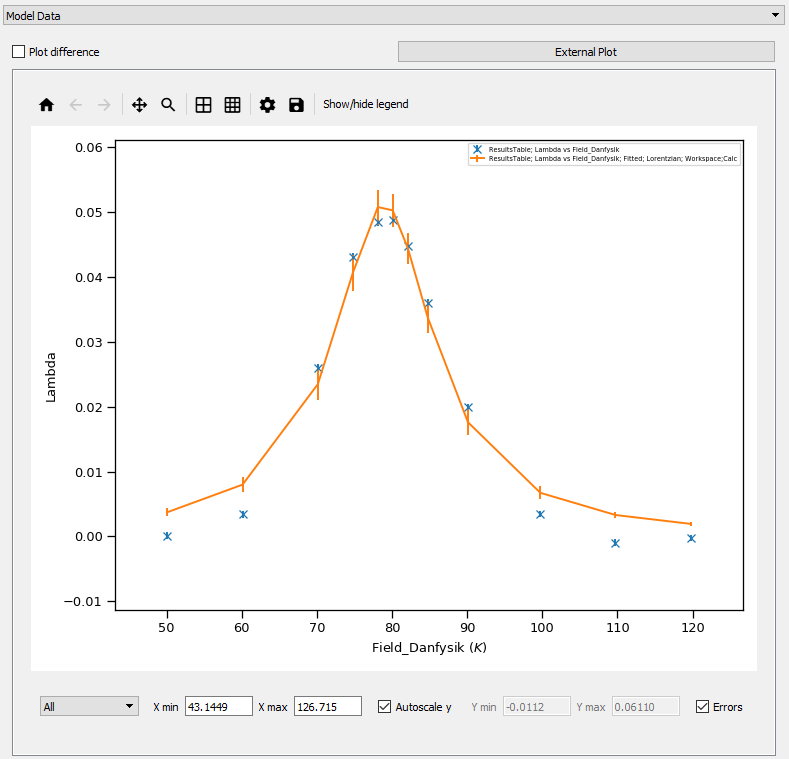
The model fitting tab is used to perform a fit across fit parameters and sample logs found in a results table. This tab allows you to select a results table, before selecting the data that should be plotted on the x and y axes. It is then possible to perform a fit using a selected fit function. The selected model fit data is displayed in a plotting pane on the right hand side of the interface. An example model fit plot is seen in the image below.
Fit Executes the specified fit.
Undo Fit Undoes the previously performed fit.
Results table Allows you to select a results table from a drop-down menu.
Select data Allows you to select the fit parameter or sample log data to be plotted on the x and y axis.
Covariance Matrix Opens the normalised covariance matrix for the currently selected fit domain.
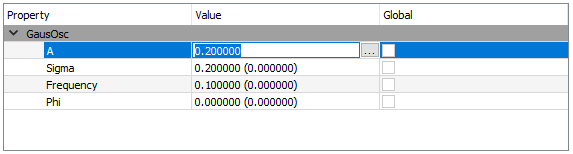
Right clicking in the central box will bring up a context menu for adding or removing functions.
Property This is a list of property names, individual functions can be collapsed down for greater legibility.
Value This lists the initial guesses for variables within fitting functions. Variables can be fixed for a given fit from the edit parameter values dialog box (click the ellipsis to the right of the value box).
Start/End X Defines the boundary values for the fit calculation.
Minimizer Choose the minimisation method for the fit.