\(\renewcommand\AA{\unicode{x212B}}\)
The plotting window displays the data specified by the tabs within the interface. By default this plot window is docked to the right-hand side of the main interface window, but can be undocked by double-clicking on the title bar of the window.
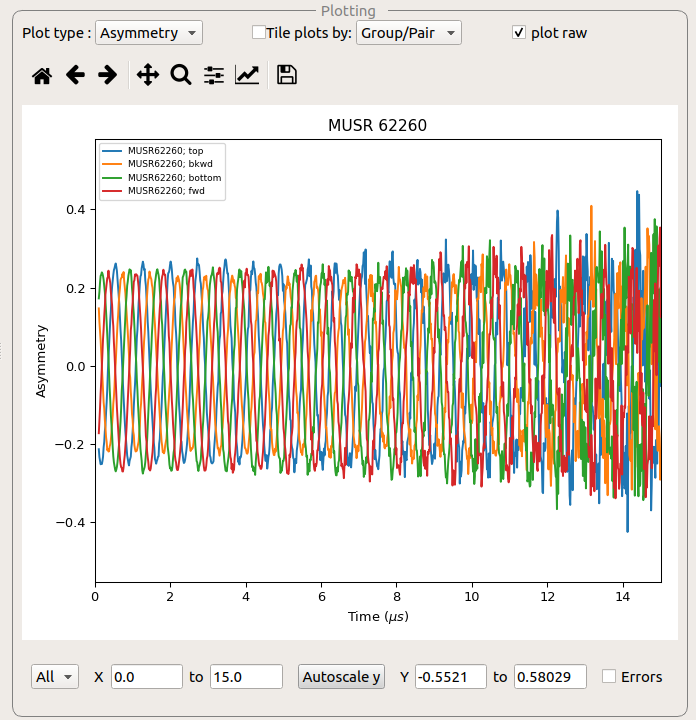
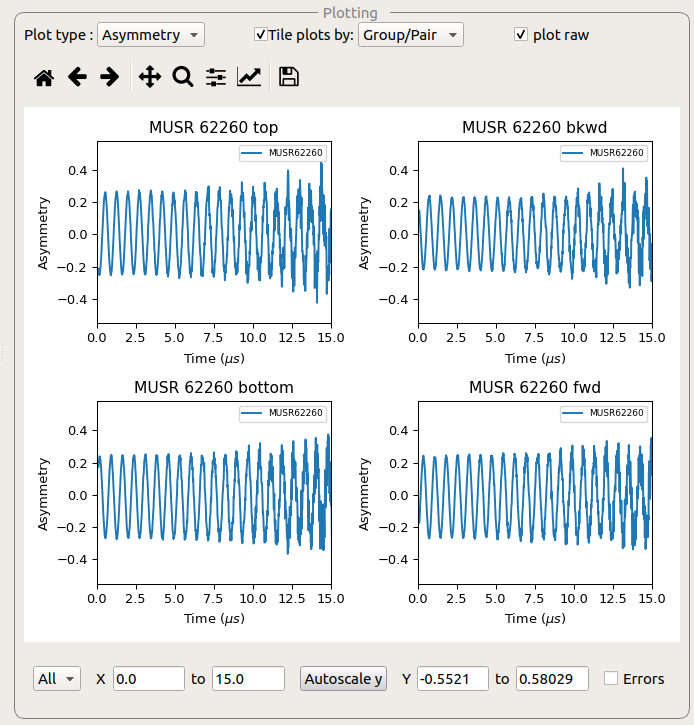
This data can be displayed as a single plot, or as tiled plots.
The custom plotting for Muon Analysis are described in the here. The custom plotting for Frequency Domain Analysis are described in the here.
At the very top of the interface is a drop down menu that selects the type of plot. The main types are:
The plotting can be controlled through serveral options:
Plot type Changes the plot type (e.g from asymmetry to counts).
Tiled plotting The ‘tile plots by’ checkbox enables tiled plotting, which can be performed over runs or Groups/pairs. This is not always available.
Plot raw Plot raw controls whether the raw or rebinned workspaces are plotted. This is not always available.
Plot difference is only available for Fit Data and Model Data. When it is ticked it shows the difference between the data and the fit to the data.

Subplot Selector Which axis to change the options for.
x-Range Sets the x-limits for the selected axes.
Autoscale Autoscales the y-axis based on the x-limits.
y-Range Sets the y-limits for the selected axes.
Errors Whether to display errors for the workspaces plotted on the selected axes.
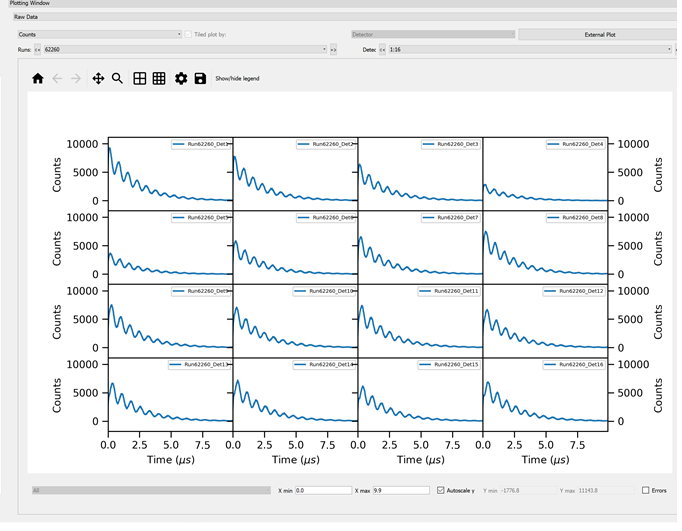
This can be used for inspecting individual detectors for potential faults. There are two selectors above the plot; one for runs and one for detectors. The runs selector allows the user to pick the run they want to plot (when loading multiple runs). The ‘detectors’ selector allows the user to choose the detectors they want to inspect. Only tiled plots can be shown and to improve the visibility of the plots the axis are identical for all subplots.
Muon Analysis, Muon Analysis Plotting, Frequency Domain Analysis, Frequency Domain Analysis Plotting,