\(\renewcommand\AA{\unicode{x212B}}\)
Waterfall Plots
Other Plot Types
General Plot Help
Plot Toolbar
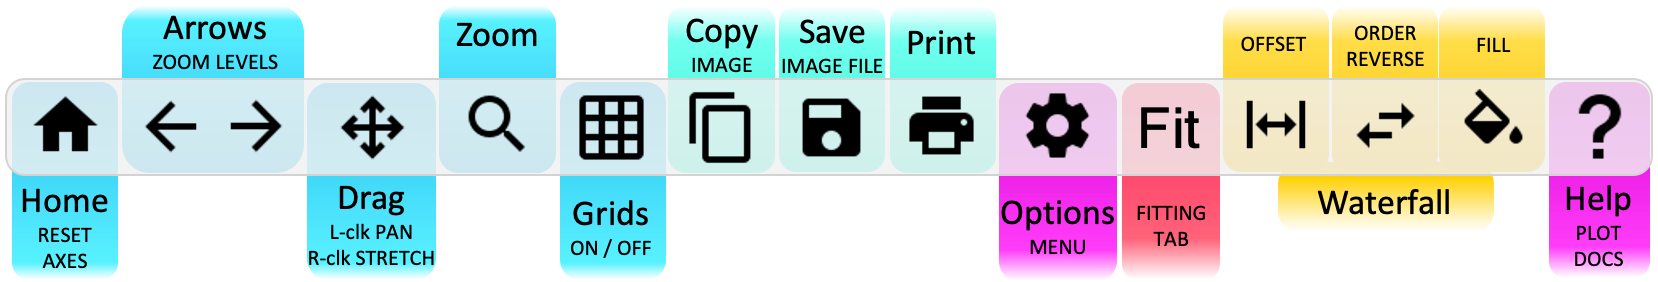
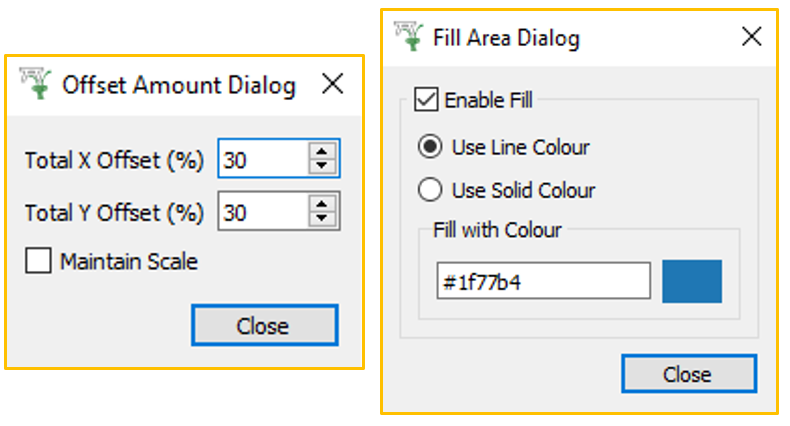
From the waterfall toolbar, access the Offset and Fill Area menus:
Click Menus
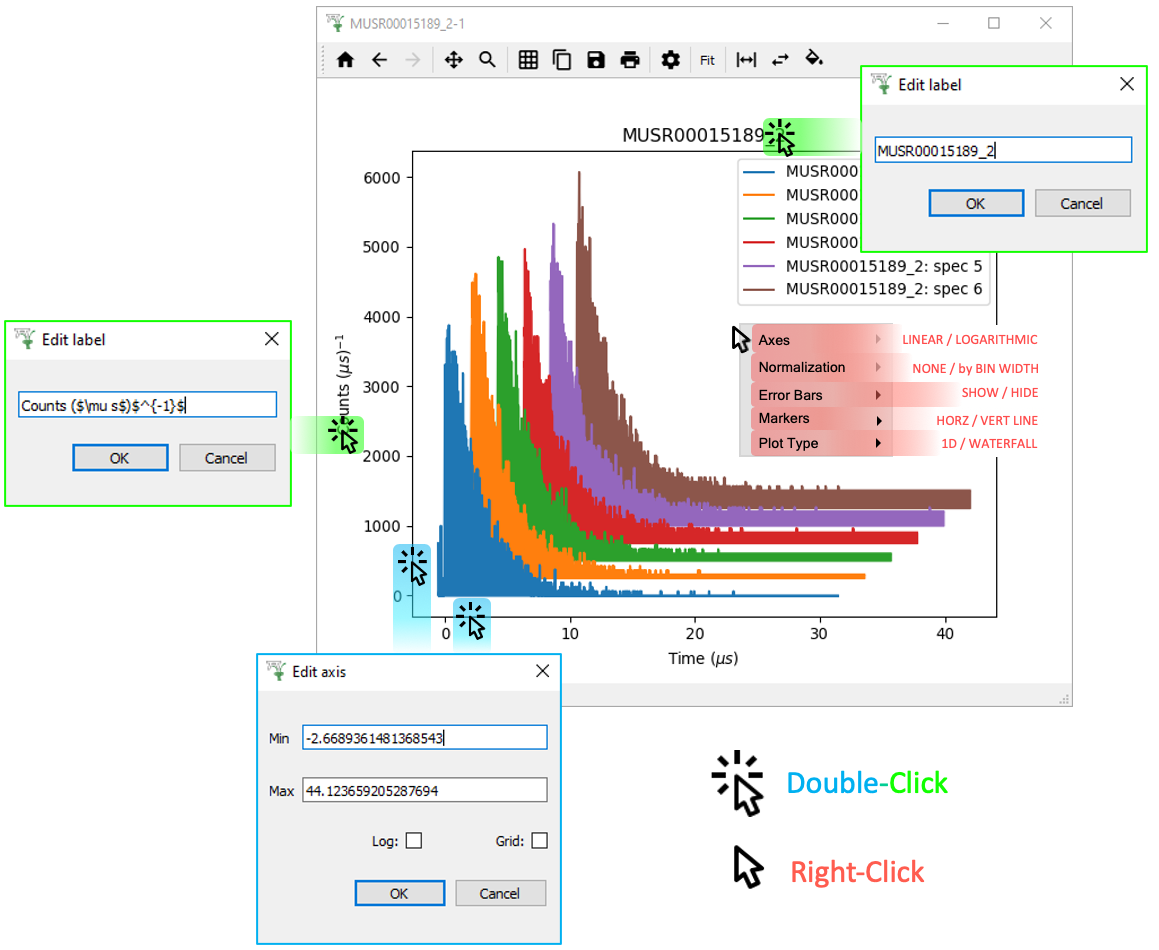
 ptions Menu
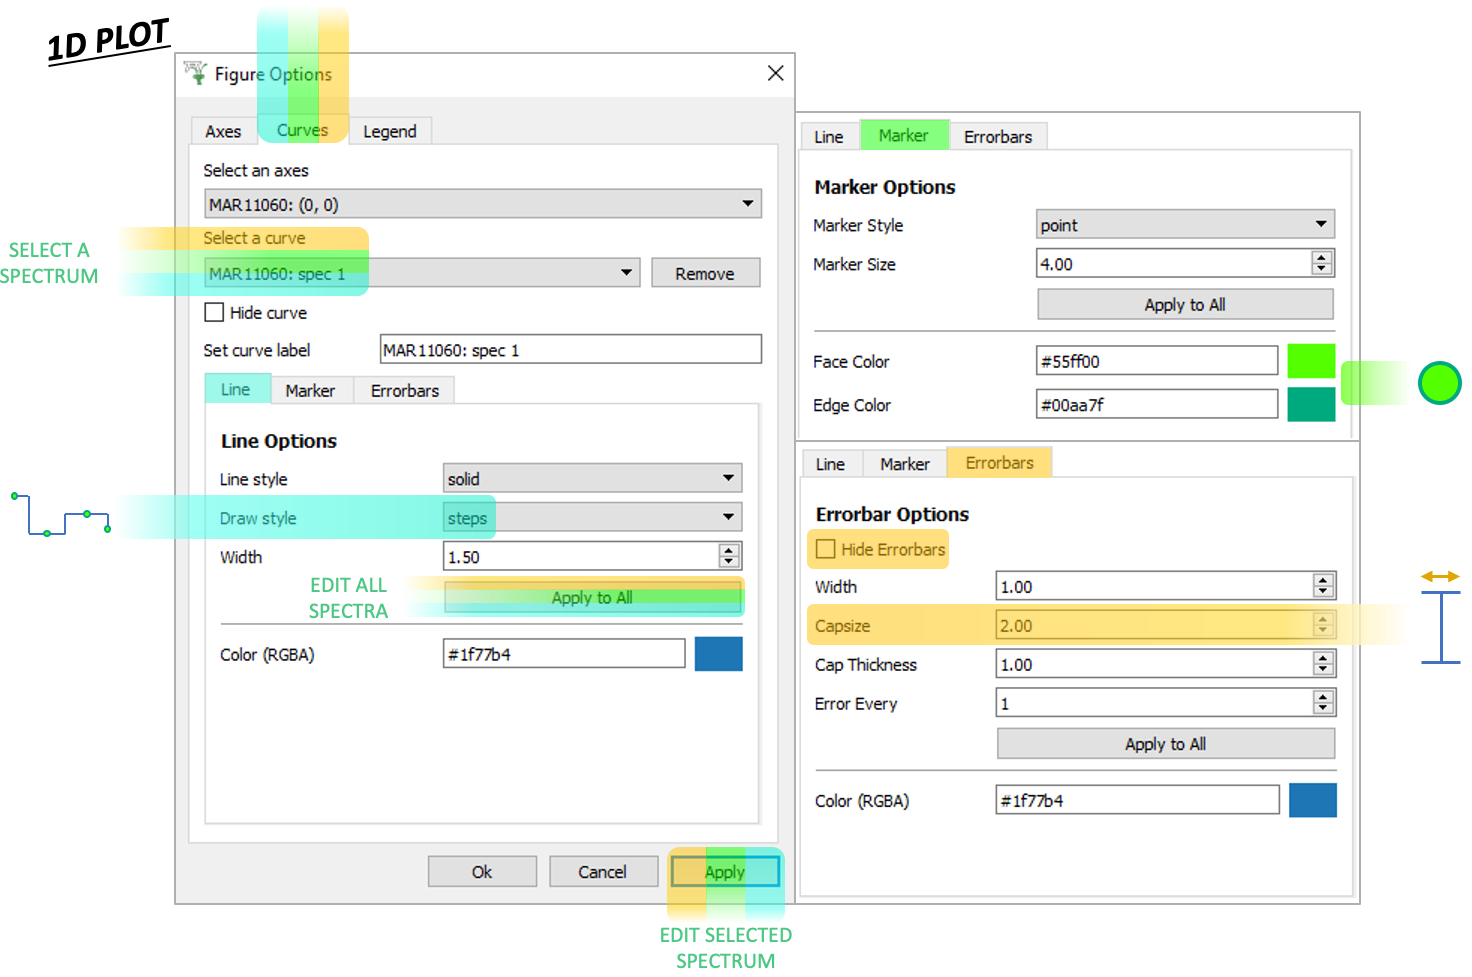
Waterfall plots are very similar to 1D plots of multiple spectra. They are simply offset, as controlled from the Waterfall Toolbar menus above.
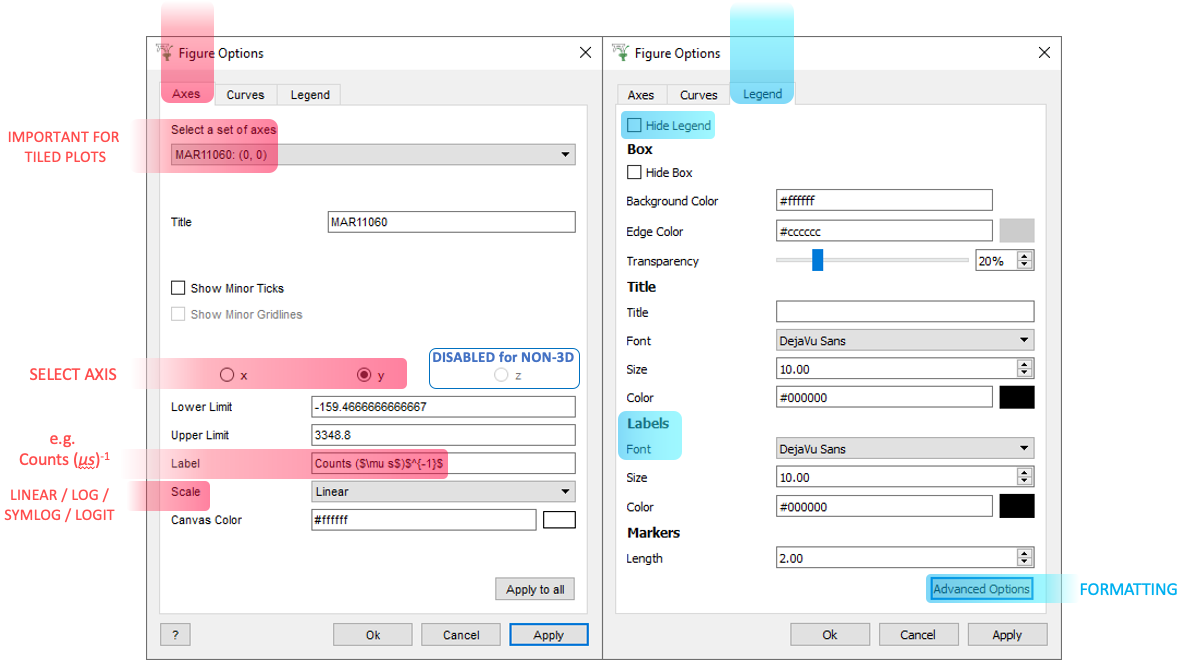
TIP: Change a Legend entry by editing Set curve label on the Curves tab.
Then on the Legend tab there are Color and Font options.
Scripting
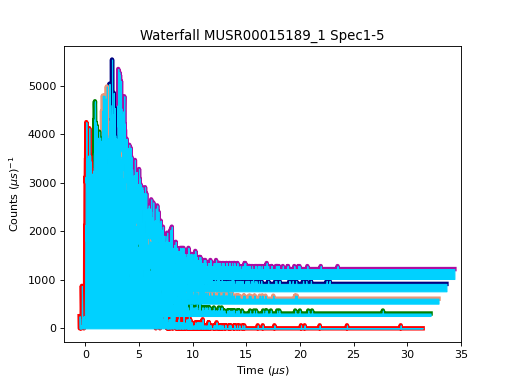
An example script for a Waterfall Plot:
# import mantid algorithms and matplotlib
from mantid.simpleapi import *
import matplotlib.pyplot as plt

from mantid.api import AnalysisDataService as ADS

# Load data and choose 1st ws from group
data = Load('MUSR00015189')
data_ws = ADS.retrieve('data_1')

# Get figure and axes with mantid projection
fig, ax = plt.subplots(subplot_kw={'projection': 'mantid'})

# Define colors and labels for desired spectra
colors = ('red', 'green', 'darksalmon', 'navy', '#AB0EA2')
labels = ('MUSR15189_1 Sp1','MUSR15189_1 Sp2', 'MUSR15189_1 Sp3', 'MUSR15189_1 Sp4', 'MUSR15189_1 Sp5')

# Plot 5 spectra in a loop
for i in range(5):
    ax.plot(data_ws, color=colors[i], label=labels[i], specNum=(i+1), linewidth = 4)

# Add title and tidy the x-axis range
plt.title('Waterfall MUSR00015189_1 Spec1-5')
ax.set_xlim(-2,35)

'''---- Convert from 1D plot to Waterfall plot ----'''
# Can set the x/y offset and choose to fill under the curves
ax.set_waterfall(True, x_offset=50, fill=True)

# Separately turn on the area fill, and choose one color for all
ax.set_waterfall_fill(True, colour="#00d1ff")

# Update the offsets
ax.update_waterfall(x_offset=10, y_offset=30)

plt.show()
(Source code, png, hires.png, pdf)
For more advice: Formatting Plots with a script
General
General Plot Help
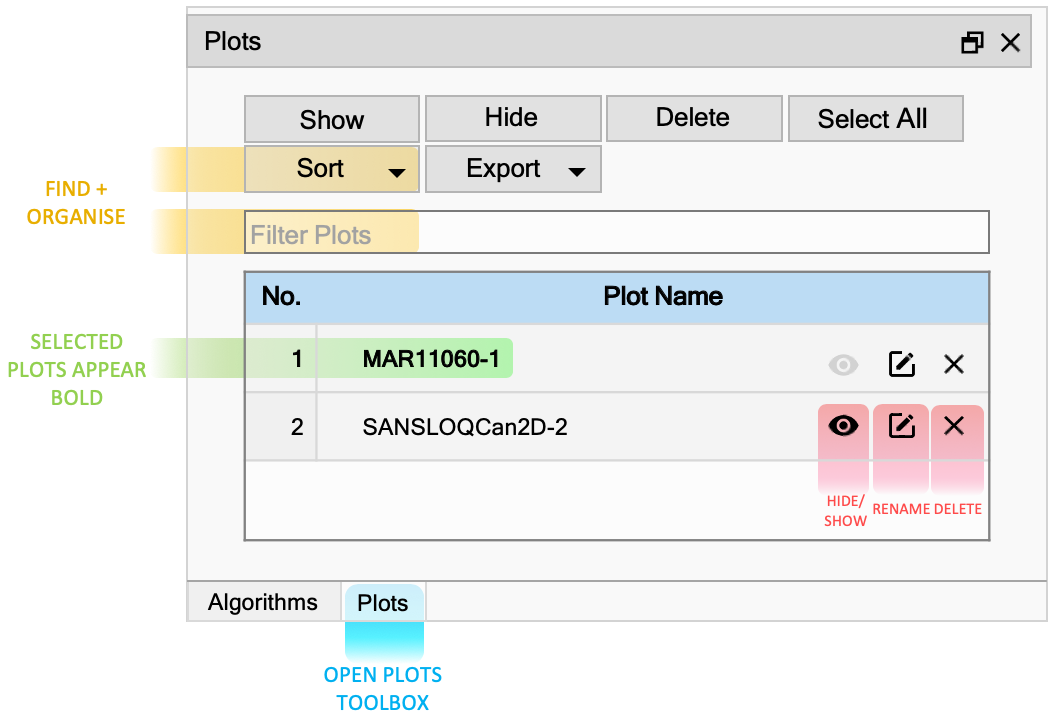
Plots Toolbox
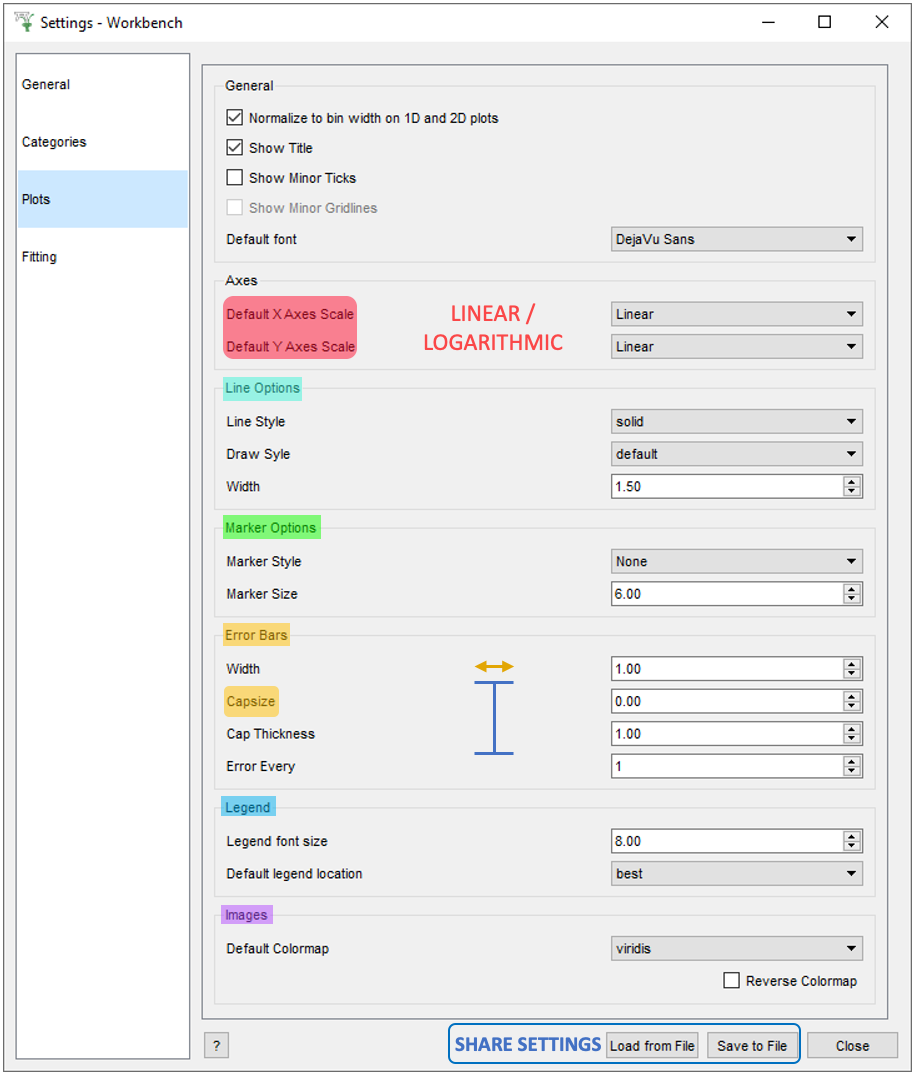
File > Settings
Other Plotting Documentation