\(\renewcommand\AA{\unicode{x212B}}\)
Fit Model Choices
Mantid contains an increasing catalog of predefined fitting function, which can be used to create a model. Some are demonstrated here.
In addition, it is possible to create new fitting functions using the User Function toolbox.
Multiple peaks + background
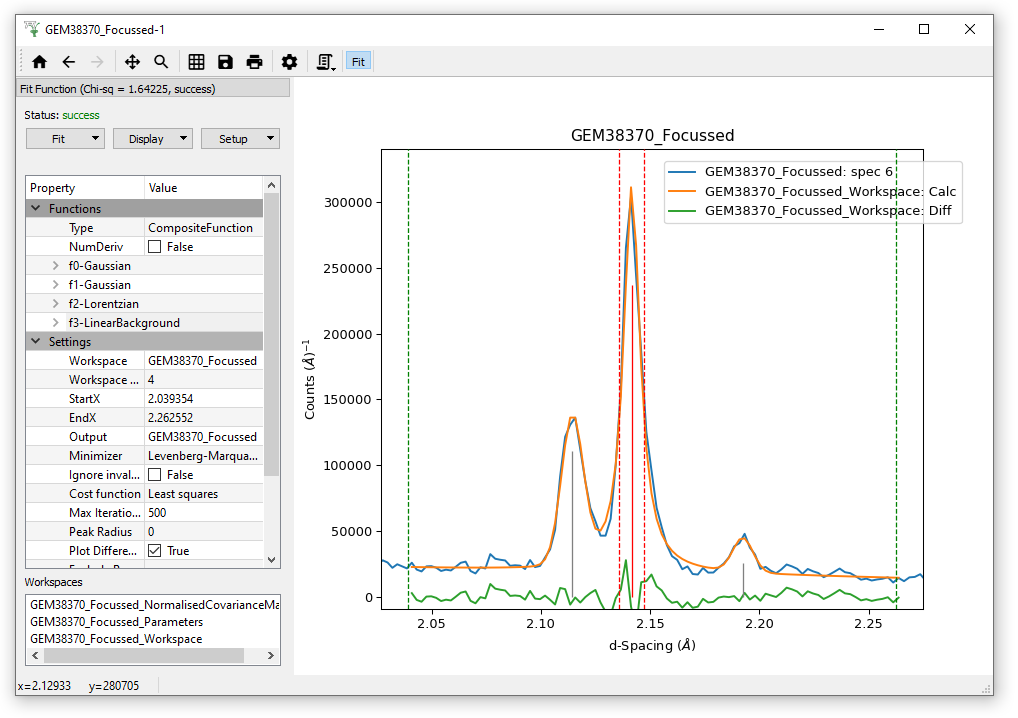
It is possible to fit overlapping peaks on a common background. Load the file GEM38370_Focussed and plot spectrum number 6. Zoom in on the 3 peaks around 2.15 Angstroms. Add a Linear Background, add a Lorentzian peak to the large central peak, and add a Gaussian peak to both of the smaller peaks, as below. Run the Fit, and inspect the results.
Non peak model + background
Fitting is not limited to peaks. You can select any other function from our list via right-click “Add other function”.
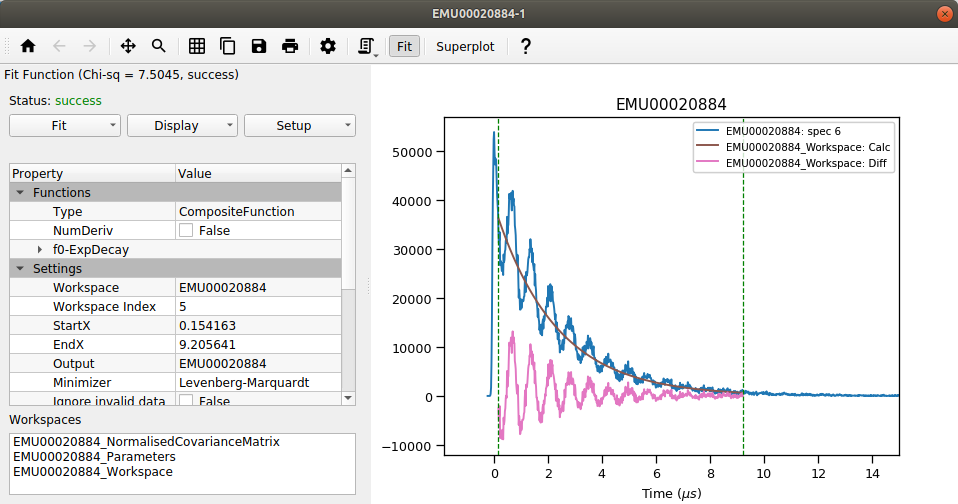
Load EMU00020884 and plot spectrum number 6. Add the other function : ExpDecay Run the Fit and inspect the results. You may need to edit the fitting range (StartX and EndX) to get a good fit!
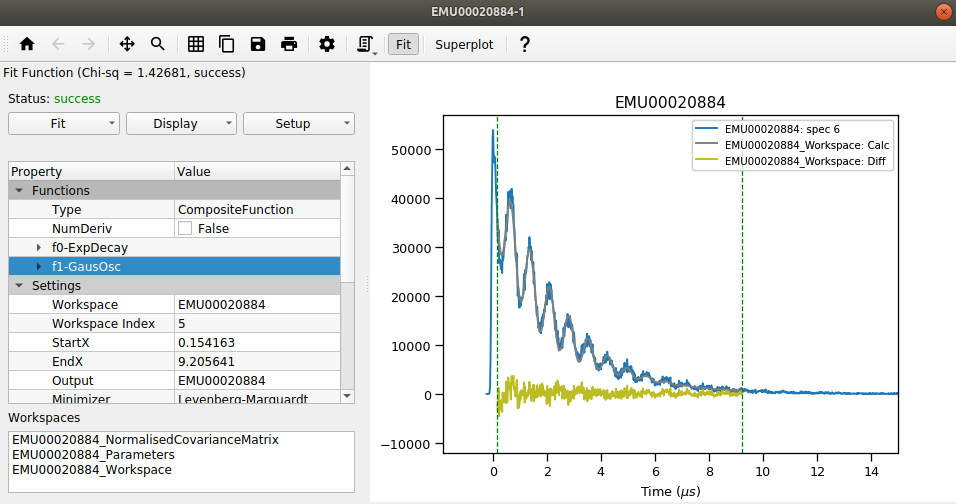
Next, add the other function : GausOsc and run the Fit again. You should find this fit is better.
Custom fitting function
User defined function
You may have spotted “UserFunction”. It can be chosen by right-clicking on a plot and selecting “Add other function”. It accepts a “Formula” as text string of a mathematical formula. All variables in the formula are treated as parameters, except for “x” which is the argument.
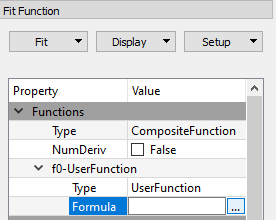
The formula can simply be entered into Fit Property Browser. Alternatively, click on the … button in the Formula input box to open the User Function Dialog:
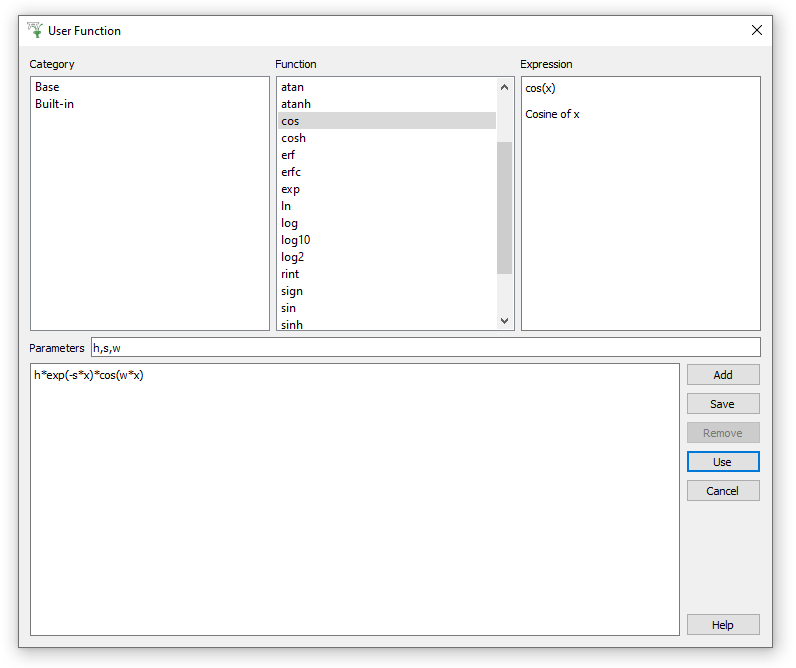
Type your function in the large lower text field. Browse the built-in functions above and add ( ) them
to your formula. The fitting parameters are displayed in the Parameters
field (read-only). If the field is empty then your formula contains errors.
) them
to your formula. The fitting parameters are displayed in the Parameters
field (read-only). If the field is empty then your formula contains errors.
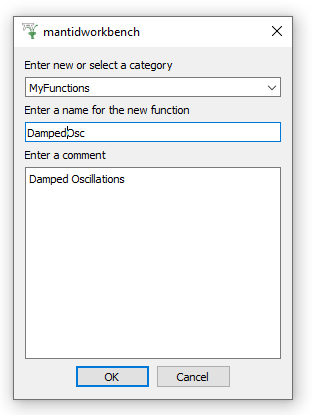
You can save the function you have defined, for future use. Click
the Save button  to see the dialog:
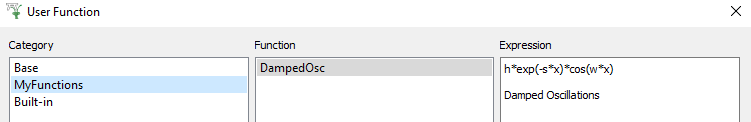
Now your function appears in the list of available functions:
Any unwanted function can be removed from the list using
 button.
When finished click the Use button  to insert the formula
into the Fit Function browser.
to insert the formula
into the Fit Function browser.
Tabulated function
A TabulatedFunction takes its values from a file or a workspace
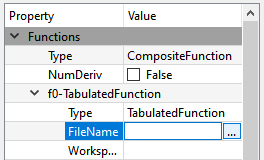
For more information on this, see here.