GroupToXResolution v1#
Summary#
Groups points within intervals given by the Dx into single points
Properties#
Name |
Direction |
Type |
Default |
Description |
|---|---|---|---|---|
InputWorkspace |
Input |
Mandatory |
An input workspace with Dx values. |
|
OutputWorkspace |
Output |
Mandatory |
The grouped workspace. |
|
FractionOfDx |
Input |
number |
0.2 |
A fraction of Dx to group the points to. |
Description#
This algorithm groups the points of a single histogram workspace according to the X resolution stored in the DX array.
The figure below shows schematically how the grouping procedure proceeds.
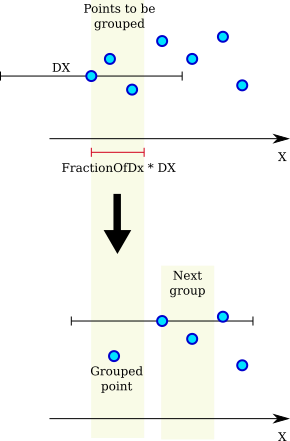
Select first ungrouped point \(i\). The X resolution (DX) for this point is \(D_{i}\).
Calculate grouping width \(w_{i} =\)
FractionOfDx* \(D_{i}\).Select ungrouped points within \(w_{i}\) from point \(i\).
Calculate the average X, average Y, and the square root of the averaged squared sums of E of the selected points.
Calculate new resolution \(D^{\circ} = \sqrt{D_{i}^{2} + (0.68 \Delta X)^{2}}\) where \(\Delta X\) is span of the X values of the selected points.
Replace the selected points with a single grouped point.
Return to 1.
Usage#
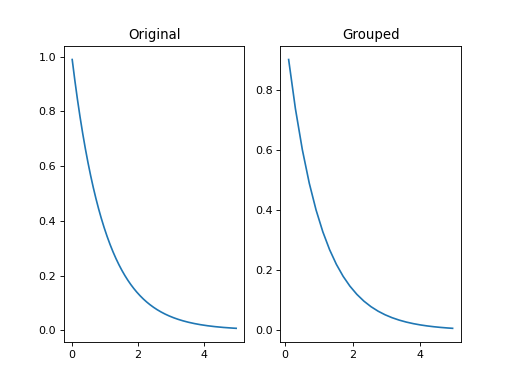
Example - Grouping points to X resolution
from mantid.simpleapi import CreateWorkspace, DeleteWorkspaces, GroupToXResolution
import matplotlib.pyplot as plt
import numpy as np
# Create a workspace with exponential decay.
Xs = np.arange(0.01, 5., 0.01)
Ys = np.exp(-Xs)
# A clumsy way for filling a numpy array.
# Numpy version > 1.7 would support 'DXs = full_like(Ys, 1.)'
DXs = np.empty_like(Ys)
DXs.fill(1.)
original = CreateWorkspace(Xs, Ys, Dx=DXs, NSpec=1)
grouped = GroupToXResolution(original)
# Plot side-by-side comparison.
fig, (left, right) = plt.subplots(ncols=2, subplot_kw={'projection':'mantid'})
left.errorbar(original, linestyle='-')
left.set_title('Original')
right.errorbar(grouped, linestyle='-')
right.set_title('Grouped')
# Uncomment the next line to show the plot window.
#fig.show()
DeleteWorkspaces(['original', 'grouped'])
(Source code, png, hires.png, pdf)
Categories: AlgorithmIndex | Transforms\Rebin
Source#
C++ header: GroupToXResolution.h
C++ source: GroupToXResolution.cpp